Table of Contents
Harnessing the wind is one of the cleanest, most sustainable ways to generate electricity. Wind power produces no toxic emissions and none of the heat-trapping emissions that contribute to global warming. This, and the fact that wind power is one of the most abundant and increasingly cost-competitive energy resources, makes it a viable alternative to the fossil fuels that harm our health and threaten the environment.
Wind energy is the fastest growing source of electricity in the world. In 2012, nearly 45,000 megawatts (MW) of new capacity were installed worldwide. This stands as a 10 percent increase in annual additions compared with 2011 [1].
The United States installed a record 13,351 MW of wind power in 2012, capable of producing enough electricity to power more than 3 million typical homes [2]. While wind energy accounted for just under four percent of USelectricity generation in 2012, it already generates more than 10 percent of the electricity in nine USstates [3]. Thanks to its many benefits and significantly reduced costs, wind power is poised to play a major role as we move toward a sustainable energy future.
The history of wind power
Wind power is both old and new. From the sailing ships of the ancient Greeks, to the grain mills of pre-industrial Holland, to the latest high-tech wind turbines rising over the Minnesota prairie, humans have used the power of the wind for millennia.
In the United States, the original heyday of wind was between 1870 and 1930, when thousands of farmers across the country used wind to pump water. Small electric wind turbines were used in rural areas as far back as the 1920s, and prototypes of larger machines were built in the 1940s. When the New Deal brought grid-connected electricity to the countryside, however, windmills lost out.
Interest in wind power was reborn during the energy crises of the 1970s. Research by the USDepartment of Energy (DOE) in the 1970s focused on large turbine designs, with funding going to major aerospace manufacturers. While these 2- and 3-MW machines proved mostly unsuccessful at the time, they did provide basic research on blade design and engineering principles.
The modern wind era began in California in the 1980s. Between 1981 and 1986, small companies and entrepreneurs installed 15,000 medium-sized turbines, providing enough power for every resident of San Francisco. Pushed by the high cost of fossil fuels, a moratorium on nuclear power, and concern about environmental degradation, the state provided tax incentives to promote wind power. These, combined with federal tax incentives, helped the wind industry take off. After the tax credits expired in 1985, wind power continued to grow, although more slowly. Perhaps more important in slowing wind power's growth was the decline in fossil fuel prices that occurred in the mid-1980s.
In the early 1990s, improvements in technology resulting in increased turbine reliability and lower costs of production provided another boost for wind development. In addition, concern about global warming and the first Gulf War lead Congress to pass the Energy Policy Act of 1992 — comprehensive energy legislation that included a new production tax credit for wind and biomass electricity. However, shortly thereafter, the electric utility industry began to anticipate a massive restructuring, where power suppliers would become competitors rather than protected monopolies. Investment in new power plants of all kinds fell drastically, especially for capital-intensive renewable energy technologies like wind. The United State's largest wind company, Kenetech, declared bankruptcy in 1995, a victim of the sudden slowdown. It wasn’t until 1998 that the wind industry began to experience continuing growth in the United States, thanks in large part to federal tax incentives, state-level renewable energy requirements and incentives, and — beginning in 2001 — rising fossil fuel prices.
While the wind industry grew substantially from the early 2000’s on, it suffered from a bout of boom-and-bust cycles due to the on-again, off-again nature of federal tax incentives. In 2006, a period of uninterrupted federal support for wind began, which led to several years of record growth.
In other parts of the world, particularly in Europe, wind has had more consistent, long-term support. As a result, European countries are currently capable of meeting more of their electricity demands through wind power with much less land area and resource potential compared with the United States. Denmark, for example, already meets about 30 percent of its electricity demand from wind power. Wind generation also accounts for about 17 percent of the national power needs in Portugal, 13 percent in Ireland, and 11 percent in Germany [4]. Serious commitments to reducing global warming emissions, local development, and the determination to avoid fuel imports have been the primary drivers of wind power development in Europe.
Clean Energy Momentum: From Goals to Gigawatts
The wind resource
The wind resource—how fast it blows, how often, and when—plays a significant role in its power generation cost. The power output from a wind turbine rises as a cube of wind speed. In other words, if wind speed doubles, the power output increases eight times. Therefore, higher-speed winds are more easily and inexpensively captured.
Wind speeds are divided into seven classes — with class one being the lowest and class seven being the highest. A wind resource assessment evaluates the average wind speeds above a section of land (e.g. 50 meters high), and assigns that area a wind class. Wind turbines operate over a limited range of wind speeds. If the wind is too slow, they won't be able to turn, and if too fast, they shut down to avoid being damaged. Wind speeds in classes three (6.7 – 7.4 meters per second (m/s)) and above are typically needed to economically generate power. Ideally, a wind turbine should be matched to the speed and frequency of the resource to maximize power production.
Since the late 1990s, the DOE National Renewable Energy Laboratory (NREL) has been working with state governments to produce and validate high-resolution wind resource potential assessments on a state-by-state basis. A 2012 assessment of the UStechnical potential for onshore wind found nearly 33,000 TWh of potential, which is equivalent to 8 times the total USpower use in 2012 [5].
Though no projects have yet been installed in the United States, the wind resources located offshore also offer great potential, with the additional advantage of being located close to highly dense coastal population centers. The technical potential for offshore wind in the USis nearly 17,000 TW, four times the total USpower use in 2012 [6].
Several factors can affect wind speed and the ability of a turbine to generate more power. For example, wind speed increases as the height from the ground increases. If wind speed at 10 meters off the ground is 6 m/s, it will be about 7.5 m/s at a height of 50 meters. A 2003 Stanford University study examined wind speeds at higher elevations and found that as much as one quarter of the United States — including areas historically thought to have poor wind potential — is potentially suitable for providing affordable electric power from wind [7]. In order to take advantage of this potential at higher elevations, the rotors of the newest wind turbines can now reach heights up to 130 meters [8]. In addition to height, the power in the wind varies with temperature and altitude, both of which affect the air density. Winter winds in Minnesota will carry more power than summer winds of the same speed high in the passes of southern California.
The more the wind blows, the more power will be produced by wind turbines. But, of course, the wind does not blow consistently all the time. The term used to describe this is "capacity factor," which is simply the amount of power a turbine actually produces over a period of time divided by the amount of power it could have produced if it had run at its full rated capacity over that time period.
A more precise measurement of output is the "specific yield." This measures the annual energy output per square meter of area swept by the turbine blades as they rotate. Overall, wind turbines capture between 20 and 40 percent of the energy in the wind. So at a site with average wind speeds of 7 m/s, a typical turbine will produce about 1,100 kilowatt-hours (kWh) per square meter of area per year. If the turbine has blades that are 40 meters long, for a total swept area of 5,029 square meters, the power output will be about 5.5 million kWh for the year. An increase in blade length, which in turn increases the swept area, can have a significant effect on the amount of power output from a wind turbine.
Another factor in the cost of wind power is the distance of the turbines from transmission lines. Some large windy areas, particularly in rural parts of the High Plains and Rocky Mountains, have enormous potential for energy production, although they have been out of reach for development because of their distance from load centers. Recognizing this, state governments and the USDepartment of Energy have begun to collaborate on identifying these “renewable energy zones” and integrating the development of these resources through transmission planning.
A final consideration for a wind resource is the seasonal and daily variation in wind speed. If the wind blows during periods of peak power demand, power from a wind farm will be valued more highly than if it blows in off-peak periods. In California, for example, high temperatures in the central valley and low coastal temperatures near San Francisco cause powerful winds to blow across the Altamont Pass in the summer, a period of high power demand.
Addressing the variability of wind power
Dealing with the variability of wind on a large scale is by no means insurmountable for electric utilities. Grid operators must already adjust to constant changes in electricity demand, turning power plants on and off, and varying their output second-by-second as power use rises and falls. Operators always need to keep power plants in reserve to meet unexpected surges or drops in demand, as well as power plant and transmission line outages. As a result, operators do not need to respond to changes in wind output at each wind facility. In addition, the wind is always blowing somewhere, so distributing wind turbines across a broad geographic area helps smooth out the variability of the resource.
In practice, many utilities are already demonstrating that wind can make a significant contribution to their electric supply without reliability problems. Xcel Energy, which serves nearly 3.5 million customers across eight Western and Midwestern states, currently has a wind portfolio totaling 4,057 MW and plans to increase its wind capacity to 4,800 MW by 2018 [9]. In Colorado, Xcel recently relied on wind power to provide more than 50 percent of its electricity on several nights when winds were strong and power demand was low. Xcel has also produced 37 percent of its electricity from wind power in Minnesota under similar conditions [10]. There are also several areas in Europe where wind power already supplies more than 20 percent of the electricity with no adverse effects on system reliability. For instance, three states in Germany have wind electricity penetrations of at least 40 percent [11].
The challenge of integrating wind energy into the electric grid can increase costs, but not by much. Extensive engineering studies by utilities in several USregions, as well as actual operating experience in Europe have found that even with up to 20 percent penetration, the grid integration costs add only up to about 10 percent of the wholesale cost of the wind generation. However, because wind has low variable costs, it can reduce overall system operating costs by displacing the output of units with higher operating costs (e.g., gas turbines).
Increasing our use of wind power can actually contribute to a more reliable electric system. Today’s modern wind turbines have sophisticated electronic controls that allow continual adjustment of their output, and can help grid operators stabilize the grid in response to unexpected operating conditions, like a power line or power plant outage. This gives grid operators greater flexibility to respond to such events. Promising developments in storage technology could also improve reliability in the future, though there is plenty of room to greatly expand wind use without storage for at least the next couple of decades.
The mechanics of wind turbines
Modern electric wind turbines come in a few different styles and many different sizes, depending on their use. The most common style, large or small, is the "horizontal axis design" (with the axis of the blades horizontal to the ground). On this turbine, two or three blades spin upwind of the tower that it sits on.
Small wind turbines are generally used for providing power off the grid, ranging from very small, 250-watt turbines designed for charging up batteries on a sailboat, to 50-kilowatt turbines that power dairy farms and remote villages. Like old farm windmills, these small wind turbines often have tail fans that keep them oriented into the wind.
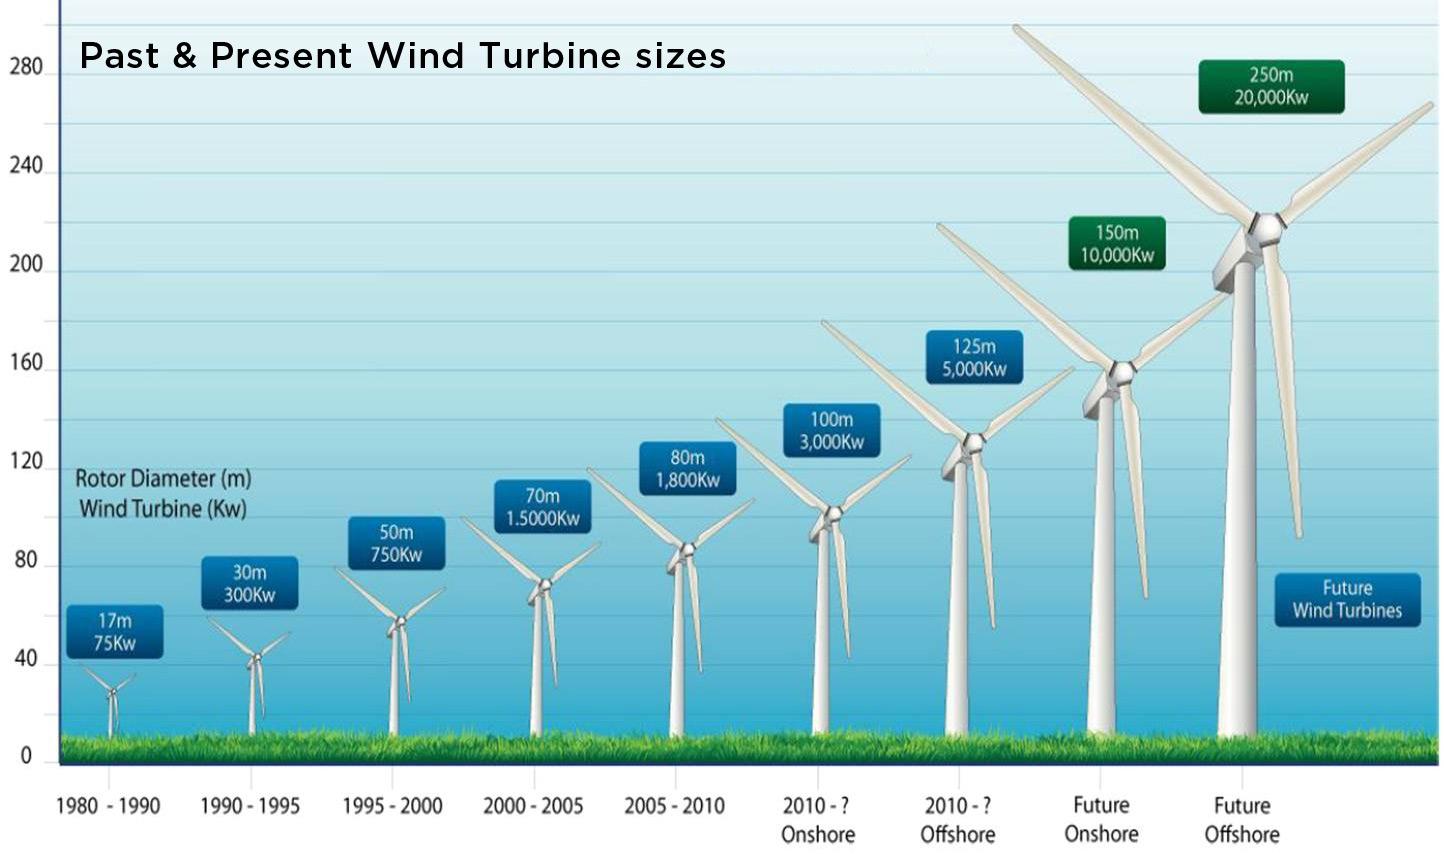
Large wind turbines, most often used by utilities to provide power to a grid, range from 250 kilowatts up to the enormous 3.5 to 5 MW machines that are being used offshore. In 2009, the average land-based wind turbines had a capacity of 1.75 MW [12]. Utility-scale turbines are usually placed in groups or rows to take advantage of prime windy spots. Wind "farms" like these can consist of a few or hundreds of turbines, providing enough power for tens of thousands of homes.
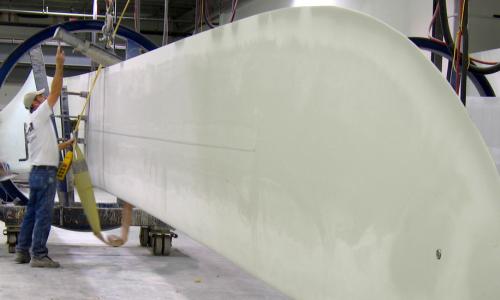
From the outside, horizontal axis wind turbines consist of three big parts: the tower, the blades, and a box behind the blades, called the nacelle. Inside the nacelle is where most of the action takes place, where motion is turned into electricity. Large turbines don't have tail fans; instead they have hydraulic controls that orient the blades into the wind.
In the most typical design, the blades are attached to an axle that runs into a gearbox. The gearbox, or transmission, steps up the speed of the rotation, from about 50 rpm up to 1,800 rpm. The faster spinning shaft spins inside the generator, producing AC electricity. Electricity must be produced at just the right frequency and voltage to be compatible with a utility grid. Since the wind speed varies, the speed of the generator could vary, producing fluctuations in the electricity. One solution to this problem is to have constant speed turbines, where the blades adjust, by turning slightly to the side, to slow down when wind speeds gust. Another solution is to use variable-speed turbines, where the blades and generator change speeds with the wind, and sophisticated power controls fix the fluctuations of the electrical output. A third approach is to use low-speed generators. Germany's Enercon turbines have a direct drive that skips the step-up gearbox.
An advantage that variable-speed turbines have over constant-speed turbines is that they can operate in a wider range of wind speeds. All turbines have upper and lower limits to the wind speed they can handle: if the wind is too slow, there's not enough power to turn the blades; if it's too fast, there's the danger of damage to the equipment. The "cut in" and "cut out" speeds of turbines can affect the amount of time the turbines operate and thus their power output.
The market for wind
The cost of electricity from the wind has dropped from about 25 cents/kWh in 1981 to averaging near 4 cents/kWh in 2008, with 50 percent of projects in the range of 3.3 to 5.2 cents/kWh (including the federal production tax credit) [13]. Though wind turbine prices have increased some since 2005 (see below for more information), in areas with the best resources, wind power is cost competitive with new generation from coal and natural gas plants. In fact, analysis by the DOE Lawrence Berkeley Lab found that wind prices have been competitive with wholesale power since 2003.
As wind power costs become more competitive, demand is growing exponentially all over the world. Global wind power capacity increased from just over 6,000 MW in 1996 to more than 282,500 MW by the end of 2012 [14]. Growth has recently been most significant in the United States, China, India, and Europe, but markets in Canada, and the rest of Asia and the Pacific are emerging quickly as well.
At the end of 2012, the USwind power market reached more than 60,000 MW. Nearly half of this capacity is located in Texas, California, Iowa, Illinois, and Oregon [15].
As of 2012, the United States had the second most installed wind capacity behind China (total wind capacity: 75,324 MW) [16]. Much wind development in the UShas been driven by the federal Production Tax Credit (PTC) and state-level renewable electricity standards (RES). The PTC provides a 2.1-cent/kWh tax credit during the first 10 years of a wind energy facility's operation [17]. Despite its being one of the primary drivers of wind development, the federal government has allowed the PTC to expire on three separate occasions since 1999. These lapses in the PTC led to a boom-bust cycle that drastically slowed the wind power industry for many months at a time.
The PTC has remained intact since late 2004, and was extended through 2012 as part of the American Recovery and Reinvestment Act of 2009 [18]. At the end of 2012, Congress passed a limited extension of the PTC for wind projects that begin construction in 2013 [19].
State-level renewable electricity standards (RES), also commonly called renewable portfolio standards (RPS), require that a minimum percentage of electricity generation comes from renewable energy. By creating demand for more renewable energy, these policies also work as a primary driver of USwind development. Nine of the top 10 states in total installed wind capacity have RES policies, and wind power accounted for an estimated 89 percent of the state RES-driven renewable energy capacity additions from 1998 to 2011 [20, 21]. In addition to serving the near-term market, the 29 states (plus Washington, DC) with renewable electricity standards are also designed to stimulate significant new development for years to come. Other state level policies are also driving the USwind power market, including renewable electricity funds and various tax incentives.
In addition, voluntary green power markets and utility "green pricing" programs have resulted in a smaller, but quickly expanding market for wind development. The DOE reports that in 2010, more than 35 million megawatt-hours of renewable energy generation was sold in voluntary markets—a significant contribution to the total USrenewable energy supply, Wind power accounted for 83 percent of those voluntary sales [22]
The future of wind power
With increasingly competitive prices, growing environmental concerns, and the call to reduce dependence on foreign energy sources, a strong future for wind power seems certain. The Global Wind Energy Council projects global wind capacity will reach 536,000 MW by 2017, almost double its current size, with growth especially concentrated in the Asia and Europe [23]. Turbines are getting larger and more sophisticated, with land-based turbines now commonly in the 1-2 MW range, and offshore turbines in the 3-5 MW range. The next frontiers for the wind industry are deep-water offshore and land-based systems capable of operating at lower wind speeds. Both technological advances will provide large areas for new development.
As with any industry that experiences rapid growth, there will be occasional challenges along the way. Like much of the USeconomy, the financial crisis has taken a heavy toll on the wind industry, slowing down the financing of new projects and stymieing progress of the growing USwind manufacturing industry. There are also concerns about collisions with bird and bat species in a few locations. And the not-in-my-backyard (NIMBY) issue continues to slow development in some regions. But new manufacturing facilities, careful siting and management practices, and increased public understanding of the significant and diverse benefits of wind energy will help overcome these obstacles. (See also: Environmental Impacts of Wind Power.)
A 2008 comprehensive study by the USDepartment of Energy found that expanding wind power to 20 percent by 2030 is feasible, affordable, and would not affect the reliability of the nation’s power supply. Besides showing that it could be done, it estimated that achieving this goal would create over 500,000 new USjobs, reduce global warming emissions by 825 million metric tons per year (about 20 percent), and save 4 trillion gallons of water [24]. Added to this list of benefits would be greatly improved air and water quality for future generations and much less vulnerability to fluctuations in fossil fuel prices. While getting to that level will require a determined national effort, wind energy is more than ready to meet the challenge.
References:
[1] Global Wind Energy Council (GWEC). Global Wind Report 2012.
[2] American Wind Energy Association (AWEA). 2013. Wind energy top source for new generation in 2012; American wind power installed new record of 13,124 MW.
[3] American Wind Energy Association (AWEA). 2013. American wind power now generates over 10 percent of electricity in nine states.
[4] Union of Concerned Scientists (UCS). 2013. Ramping Up Renewables: Energy You Can Count On.
[5] Anthony Lopez, Billy Roberts, Donna Heimiller, Nate Blair, and Gian Porro. 2012. USRenewable Energy Technical Potentials: A GIS-Based Analysis. National Renewable Energy Laboratory.
[6] Anthony Lopez, Billy Roberts, Donna Heimiller, Nate Blair, and Gian Porro. 2012. USRenewable Energy Technical Potentials: A GIS-Based Analysis. National Renewable Energy Laboratory.
[7] Archer, C.L., and M.Z. Jacobsen. 2003. Spatial and temporal distribution of USwinds and wind power at 80 m derived from measurements. Journal of Geophysical Research 108, doi:10.1029/2002JD002076,2003.
[8] Graham Richard, Michael. Enercon E-126: The World’s Largest Wind Turbine (For Now).
[9] Xcel Energy. 2011 Corporate Responsibility Report. 2011 and Projected 2018 Renewable Energy Portfolio in Megawatts (MW).
[10] Hargreaves, S. 2012. Wind power hits 57% mark in Colorado. CNNMoney, August 6.
Laughlin, T. 2012. A broken record. Minneapolis, MN: Xcel Energy.
[11] Sawin, Janet. 2009. Wind Power Increase in 2008 Exceeds 10-year Average Growth Rate. Worldwatch Institute.
[12] American Wind Energy Association (AWEA). Anatomy of a Wind Turbine.
[13] US Department of Energy, Office of Energy Efficiency and Renewable Energy. 2009. >20 Percent Wind Energy by 2030: Increasing Wind Energy’s Contribution to US Electricity Supply.
[14] Global Wind Energy Council (GWEC). Global Wind Report 2012.
[15] American Wind Energy Association (AWEA). 2013. Industry Statistics.
[16] Global Wind Energy Council (GWEC). Global Wind Report 2012.
[17] US Department of Energy, Office of Energy Efficiency and Renewable Energy. 2009. 20 Percent Wind Energy by 2030: Increasing Wind Energy’s Contribution to US Electricity Supply.
[18] Fredrikson and Byron Law, P.A. American Recovery and Reinvestment Act of 2009 – Wind Energy Provisions
[19] American Wind Energy Association (AWEA). 2013. Congress extends wind energy tax credits for projects that start in 2013.
[20] American Wind Energy Association (AWEA). 2013. AWEA USwind industry fourth quarter 2012 market report. Washington, DC.
[21] Barbose, G. 2012. Renewable portfolio standards in the United States: A status update. Presented at the 2012 National Summit on RPS, Washington, DC, December 3; accessed March 24, 2013.
[22] Heeter, j. and L. Bird. Status and Trends in USCompliance and Voluntary Renewable Energy Certificate Markets (2010 Data). Technical Report NREL/TP-6A20-52925, October 2011. National Renewable Energy Laboratory (NREL).
[23] Global Wind Energy Council (GWEC). Global Wind Report 2012.
[24] O’Connell, R., R. Pletka, S. Block, R. Jacobson, P. Smith, S. Tilley, and A. York. 2007. 20 percent wind energy penetration in the United States: A technical analysis of the energy resource. Overland Park, KS: Black & Veatch.
Related resources
Understanding Future Groundwater Sustainability Scenarios

Earth Day Two Ways
State Electric Vehicle Benefits