Table of Contents
Global warming emissions
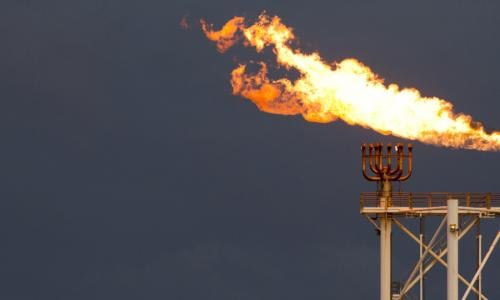
Natural gas is a fossil fuel. The global warming emissions from burning natural gas are lower than those from coal or oil, but much higher than clean energy sources like wind or solar.
Emissions from smokestacks and tailpipes, however, do not tell the full story.
The drilling and extraction of gas from wells and its transportation in pipelines results in the leakage of methane, the primary component of natural gas. Methane is 34 times stronger than CO2 at trapping heat over a 100-year period and 86 times stronger over 20 years [3]. Studies as well as field and aerial measurements have shown that high rates of methane leakage can be found throughout the natural gas system.
Whether gas has lower life cycle greenhouse gas emissions than coal and oil depends on the leakage rate, the time frame employed for evaluating global warming potential, the energy conversion efficiency, and other factors [5]. One study found that methane losses must be kept below 3.2 percent for natural gas power plants to have lower life cycle emissions than new coal plants over short time frames of 20 years or fewer [6]. And if burning natural gas in vehicles is to deliver even marginal benefits, methane losses must be kept below 1 percent and 1.6 percent compared with diesel fuel and gasoline, respectively. Technologies are available to reduce much of the leaking methane, but deploying such technology would require new policies and investments [7].
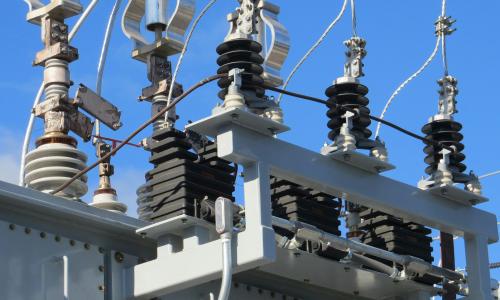
Air pollution
The combustion of natural gas produces nitrogen oxides (NOx), which are precursors to smog, and small amounts of sulfur, mercury, and particulates.
Unconventional gas development can also affect local and regional air quality in other ways. Some areas where drilling occurs have experienced increases in concentrations of hazardous air pollutants and two of the six “criteria pollutants”—particulate matter and ozone plus its precursors—regulated by the EPA because of their harmful effects on health and the environment [9]. Exposure to elevated levels of these air pollutants can lead to adverse health outcomes, including respiratory symptoms, cardiovascular disease, and cancer [11]. One study found that residents living less than half a mile from unconventional gas well sites were at greater risk of health effects from air pollution from natural gas development than those living farther from the well sites [12]. Too often, the toll of that pollution is inequitably borne.
Land use and wildlife
The construction and land disturbance required for oil and gas drilling can alter land use and harm local ecosystems by causing erosion and fragmenting wildlife habitats and migration patterns. When oil and gas operators clear a site to build a well pad, pipelines, and access roads, the construction process can cause erosion of dirt, minerals, and other harmful pollutants into nearby streams [13].
A study of hydraulic fracturing impacts in Michigan found potential environmental impacts to be “significant” and include increased erosion and sedimentation, increased risk of aquatic contamination from chemical spills or equipment runoff, habitat fragmentation, and reduction of surface waters as a result of the lowering of groundwater levels [14].
Water use and pollution
Unconventional oil and gas development may pose health risks to nearby communities through contamination of drinking water sources with hazardous chemicals used in drilling the wellbore, hydraulically fracturing the well, processing and refining the oil or gas, or disposing of wastewater [15]. Naturally occurring radioactive materials, methane, and other underground gases have sometimes leaked into drinking water supplies from improperly cased wells; methane is not associated with acute health effects but in sufficient volumes may pose flammability concerns [16]. The large volumes of water used in unconventional oil and gas development also raise water-availability concerns in some communities.
Groundwater
There have been documented cases of groundwater near oil and gas wells being contaminated with fracking fluids as well as with gases, including methane and volatile organic compounds. One major cause of gas contamination is improperly constructed or failing wells that allow gas to leak from the well into groundwater. Cases of contamination have been documented in Ohio and Pennsylvania [17].
Another potential avenue for groundwater contamination is natural or man-made fractures in the subsurface, which could allow stray gas to move directly between an oil and gas formation and groundwater supplies.
In addition to gases, groundwater can become contaminated with hydraulic fracturing fluid [18]. In several cases, groundwater was contaminated from surface leaks and spills of fracturing fluid. Fracturing fluid also may migrate along abandoned wells, around improperly sealed and constructed wells, through induced fractures, or through failed wastewater pit liners [19].
Surface Water
Unconventional oil and gas development also poses contamination risks to surface waters through spills and leaks of chemical additives, spills and leaks of diesel or other fluids from equipment on-site, and leaks of wastewater from facilities for storage, treatment, and disposal. Unlike groundwater contamination risks, surface water contamination risks are mostly related to land management and to on- and off-site chemical and wastewater management.
The EPA has identified more than 1,000 chemical additives that are used for hydraulic fracturing, including acids (notably hydrochloric acid), bactericides, scale removers, and friction-reducing agents. Only maybe a dozen chemicals are used for any given well, but the choice of which chemicals is well-specific, depending on the geochemistry and needs of that well [20]. Large quantities — tens of thousands of gallons for each well — of the chemical additives are trucked to and stored on a well pad. If not managed properly, the chemicals could leak or spill out of faulty storage containers or during transport.
Drilling muds, diesel, and other fluids can also spill at the surface [21]. Improper management of flowback or produced wastewater can cause leaks and spills. There is also risk to surface water from deliberate improper disposal of wastewater by bad actors.
Water Use
The growth of hydraulic fracturing and its use of huge volumes of water per well may strain local ground and surface water supplies, particularly in water-scarce areas. The amount of water used for hydraulically fracturing a well can vary because of differences in formation geology, well construction, and the type of hydraulic fracturing process used [22]. The EPA estimates that 70 billion to 140 billion gallons of water were used nationwide in 2011 for fracturing an estimated 35,000 wells [23]. Unlike other energy-related water withdrawals, which are commonly returned to rivers and lakes, most of the water used for unconventional oil and gas development is not recoverable. Depending on the type of well along with its depth and location, a single well with horizontal drilling can require 3 million to 12 million gallons of water when it is first fractured — dozens of times more than what is used in conventional vertical wells [24]. Similar vast volumes of water are needed each time a well undergoes a “work over,” or additional fracturing later in its life to maintain well pressure and gas production. A typical shale gas well will have about two work overs during its productive life span [25].
Earthquakes
Hydraulic fracturing itself has been linked to low-magnitude seismic activity—less than 2 moment magnitude (M) [the moment magnitude scale now replaces the Richter scale]— but such mild events are usually undetectable at the surface [26]. The disposal of fracking wastewater by injecting it at high pressure into deep Class II injection wells, however, has been linked to larger earthquakes in the United States [27]. At least half of the 4.5 M or larger earthquakes to strike the interior of the United States in the past decade have occurred in regions of potential injection-induced seismicity [28]. Although it can be challenging to attribute individual earthquakes to injection, in many cases the association is supported by timing and location of the events [29].
References:
[1] National Energy Technology Laboratory (NETL). 2010. Cost and performance baseline for fossil energy plants, Volume 1: Bituminous coal and natural gas to electricity. Revision 2. November. DOE/NETL-2010/1397. United States Department of Energy.
[2] FuelEconomy.gov. 2013. Find a car: Compare side-by-side. U.S. Department of Energy.
Argonne National Laboratory (ANL). 2012. GREET 2 2012 rev1. U.S. Department of Energy.
[3] Myhre, G., D. Shindell, F.-M. Bréon, W. Collins, J. Fuglestvedt, J. Huang, D. Koch, J.-F. Lamarque, D. Lee, B. Mendoza, T. Nakajima, A. Robock, G. Stephens, T. Takemura, and H. Zhang. 2013. Anthropogenic and natural radiative forcing. In Climate change 2013: The physical science basis: Contribution of Working Group I to the fifth assessment report of the Intergovernmental Panel on Climate Change, edited by T.F. Stocker, D. Qin, G.-K. Plattner, M. Tignor, S.K. Allen, J. Boschung, A. Nauels, Y. Xia, V. Bex, and P.M. Midgley. Cambridge, England: Cambridge University Press, 659–740. Online at www.climatechange2013.org/images/report/WG1AR5_Chapter08_FINAL.pdf.
[4] Tollefson, J. 2013. Methane leaks erode green credentials of natural gas. Nature 493,doi:10.1038/493012a.
Cathles, L.M., L. Brown, M. Taam, and A. Hunter. 2012. A commentary on “The greenhouse gas footprint of natural gas in shale formations” by R.W. Howarth, R. Santoro, and A. Ingraffea. Climatic Change doi:10.1007/s10584-011-0333-0.
Howarth, R.W., D. Shindell, R. Santoro, A. Ingraffea, N. Phillips, and A. Townsend-Small. 2012. Methane emissions from natural gas systems. Background paper prepared for the National Climate Assessment. Reference number 2011-0003.
Petron, G., G. Frost, B.T. Miller, A.I. Hirsch, S.A. Montzka, A. Karion, M. Trainer, C. Sweeney, A.E. Andrews, L. Miller, J. Kofler, A. Bar-Ilan, E.J. Dlgokencky, L. Patrick, C.T. Moor, T.B. Ryerson, C. Siso, W. Kolodzev, P.M. Lang, T. Conway, P. Novelli, K. Masarie, B. Hall, D. Guenthere, D. Kitzis, J. Miller, D. Welsh, D. Wolfe, W. Neff, and P. Tans. 2012. Hydrocarbon emissions characterization in the Colorado Front Range: A pilot study. Journal of Geophysical Research in press, doi: 10.1029/2011JD016360.
Skone, T. 2012. Role of alternative energy sources: Natural gas power technology assessment. DOE/NETL-2011/1536. National Energy Technology Laboratory.
[5] Bradbury et al. 2013
[6] Alvarez, R.A., S.W. Pacala, J.J. Winebrake, W.L. Chameides, and S.P. Hamburg. 2012. Greater focus needed on methane leakage from natural gas infrastructure. Proceedings of the National Academy of Sciences 109:6435–6440.
[7] Alvarez, R.A., S.W. Pacala, J.J. Winebrake, W.L. Chameides, and S.P. Hamburg. 2012. Greater focus needed on methane leakage from natural gas infrastructure. Proceedings of the National Academy of Sciences 109:6435–6440.
Wigley, T.M.L. 2011. Coal to gas: The influence of methane leakage. Climatic Change 108:601−608. Boulder, CO: National Center for Atmospheric Research.
Harvey, S., V. Gowrishankar, and T. Singer. 2012. Leaking profits: The U.S. oil and gas industry can reduce pollution, conserve resources, and make money by preventing methane waste. New York: Natural Resources Defense Council.
International Energy Agency (IEA). 2012. Golden rules for a golden age of gas: World energy outlook special report on unconventional gas. Paris. Online here. (Bradbury et al. 2013)
[8] National Renewable Energy Laboratory. 1999. Life Cycle Assessment of Coal-fired Power Production.
National Renewable Energy Laboratory. 2000. Life Cycle Assessment of a Natural Gas Combined-Cycle Power Generation System.
[9] California Environmental Protection Agency Air Resources Board. 2012. Health Effects of Air Pollution.
[10] Lyman, S., and H. Shorthill, 2013. 2012 Uintah Basin winter ozone & air quality study. Final report. Document no. CRD13-320.32. Commercialization and Regional Development. Utah State University. February 1.
Environmental Protection Agency (EPA). 2012. What are the six common air pollutants? April 20.
McKenzie, L.M., R.Z. Witter, L.S. Newman, and J.L. Adgate. 2012. Human health risk assessment of air emissions from development of unconventional natural gas resources. Science of the Total Environment 424: 79–87. doi:10.1016/j.scitotenv.2012.02.018.
Petron, G., G. Frost, B.R. Miller, A.I. Hirsch, S.A. Montzka, A. Karion, M. Trainer, C. Sweeney, A.E. Andrews, L. Miller, J. Kofler, A. Bar-Ilan, E.J. Dlugokencky, L. Patrick, C.T. Moore, Jr., T.B. Ryerson, C. Siso,
W. Kolodzey, P.M. Lang, T. Conway, P. Novelli, K. Masarie, B. Hall, D. Guenther, D. Kitzis, J. Miller, D. Welsh, D. Wolfe, W. Neff, and P. Tans. 2012. Hydrocarbon emissions characterization in the Colorado Front Range: A pilot study. Journal of Geophysical Research: Atmospheres 117(D4). doi:10.1029/2011JD016360.
[11] Environmental Protection Agency (EPA). 2013. Ground level ozone. August 14.
Environmental Protection Agency (EPA). 2013. Particulate matter (PM). March 18. >
Agency for Toxic Substances & Disease Registry (ATSDR). 2004. Interaction profile for toxic substances: Benzene, toluene, ethylbenzene, and xylenes (BTEX). May.
[13] Williams, H.F.L., D.L. Havens, K.E. Banks, and D.J. Wachal. 2008. Field-based monitoring of sediment runoff from natural gas well sites in Denton County, Texas, USA. Environmental Geology 55:1463–1471.
[14] Burton, G.A., K.J. Nadelhoffer, and K. Presley. 2013. Hydraulic fracturing in the state of Michigan: Environment/ecology technical report. University of Michigan. September 3.
[15] Colborn, T., C. Kwiatkowski, K. Schultz, and M. Bachran. 2011. Natural gas operations from a public health perspective. Human and Ecological Risk Assessment: An International Journal. 17(5):1039–1056. October.
[16] Airgas. 2013. Material Safety Data Sheet: Methane.
[17] Pennsylvania Department of Environmental Protection (PADEP). 2009. Accessed September 15, 2013.
Ohio Department of Natural Resources, Division of Mineral Resources Management. 2008. Report on the investigation of the natural gas invasion of aquifers in Bainbridge Township of Geauga County, Ohio. September 1.
[18] New Mexico Oil Conservation Division (NMOCD). 2008. Cases where pit substances contaminated New Mexico’s ground water. September 12.
[19] Vidic, R.D., S.L. Brantley, J.M. Vandenbossche, D. Yoxtheimer, and J.D. Abad. 2013. Impact of shale gas development on regional water quality. Science 340(6134). doi:10.1126/science.1235009.
Harrison, S.S. 1983. Evaluating system for ground-water contamination hazards due to gas-well drilling on the glaciated Appalachian Plateau. Groundwater 21(6):689–700.
[20] Environmental Protection Agency (EPA). 2012. Study of the potential impacts of hydraulic fracturing on drinking water resources. Progress report. EPA 601/R-12/011. December.
National Energy Technology Laboratory (NETL). 2009. Modern shale gas development in the United States: A Primer. United States Department of Energy. April.
[21] Wiseman, H.J. 2013c. Risk and response in fracturing policy. 84 U. Colo. L. Rev. 758-61, 766-70, 788-92.
[22] Haluszczak, L.O., A.W. Rose, and L.R. Kump. 2012. Geochemical evaluation of flowback brine from Marcellus gas wells in Pennsylvania, USA. Applied Geochemistry 28:55–61.
Rowan, E.L., M.A. Engle, C.S. Kirby, and T.F. Kraemer. 2011. Radium content of oil- and gas-field produced waters in the northern Appalachian Basin (USA): Summary and discussion of data. U.S. Geological Survey. Scientific investigations report 2011–5135.
[23] Environmental Protection Agency (EPA). 2012f. Study of the potential impacts of hydraulic fracturing on drinking water resources. Progress report. EPA 601/R-12/011. December.
[24] Environmental Protection Agency (EPA). 2013a. Natural gas extraction — hydraulic fracturing. July 12.
[25] Breitling Oil and Gas. 2012. US shale faces water, transparency complaints. October 4.
National Energy Technology Laboratory (NETL). 2009. Modern shale gas development in the United States: A Primer. United States Department of Energy. April.
[26] National Energy Technology Laboratory (NETL). 2010. Cost and performance baseline for fossil energy plants, Volume 1: Bituminous coal and natural gas to electricity. Revision 2. November. DOE/NETL-2010/1397. United
States Department of Energy.
[27] National Research Council. 2013. Induced seismicity potential in energy technologies. Washington, DC: The National Academies Press.
Royal Society, The, and The Royal Academy of Engineering. 2012. Shale gas extraction in the UK: A review of hydraulic fracturing. June.
[28] van der Elst, N.J. et al. 2013. Enhanced remote earthquake triggering at fluid-injection sites in the Midwestern United States. Science, v. 341, p.164-167.
[29] Van der Elst 2013.
Related resources
State Electric Vehicle Benefits

Feet To The Fire
Siting for a Cleaner, More Equitable Grid in Massachusetts