Table of Contents
We’ve all paid a utility bill or purchased gasoline. Those represent the direct costs of fossil fuels; money paid out of pocket for energy from coal, natural gas, and oil.
But those expenses don’t reflect the total cost of fossil fuels to each of us individually or to society as a whole. Known as externalities, the hidden costs of fossil fuels aren’t represented in their market price, despite serious impacts to our health and environment.
Externalities are sometimes easy to see, such as pollution and land degradation, and sometimes less obvious, such as the costs of asthma and cancer, or the impacts of sea level rise. Many consequences are far removed from our daily lives and may only affect a minority or marginalized subset of the population.
Costs accrue at every point of the fossil fuel supply chain. Extraction processes can generate air and water pollution, and harm local communities. Transporting fuels from the mine or well can cause air pollution and lead to serious accidents and spills. When the fuels are burned, they emit toxins and global warming emissions. Even the waste products are hazardous to public health and the environment.
Understanding these impacts is critical for evaluating the true cost of fossil fuels—and for informing our choices around the future of energy production.
What are fossil fuels?
Fossil fuels are rock-like, gas, or liquid resources that are burned to generate power. They include coal, natural gas, and oil, and are used as an energy source in the electricity and transportation sectors. They’re also a leading source of the world’s global warming pollution.
Extracting fossil fuels

Everything to Know About Coal (in Under 3 Minutes)
There are two main methods for removing fossil fuels from the ground: mining and drilling. Mining is used to extract solid fossil fuels, such as coal, by digging, scraping, or otherwise exposing buried resources. Drilling methods help extract liquid or gaseous fossil fuels that can be forced to flow to the surface, such as conventional oil and natural gas. Both processes carry serious health and environmental impacts.
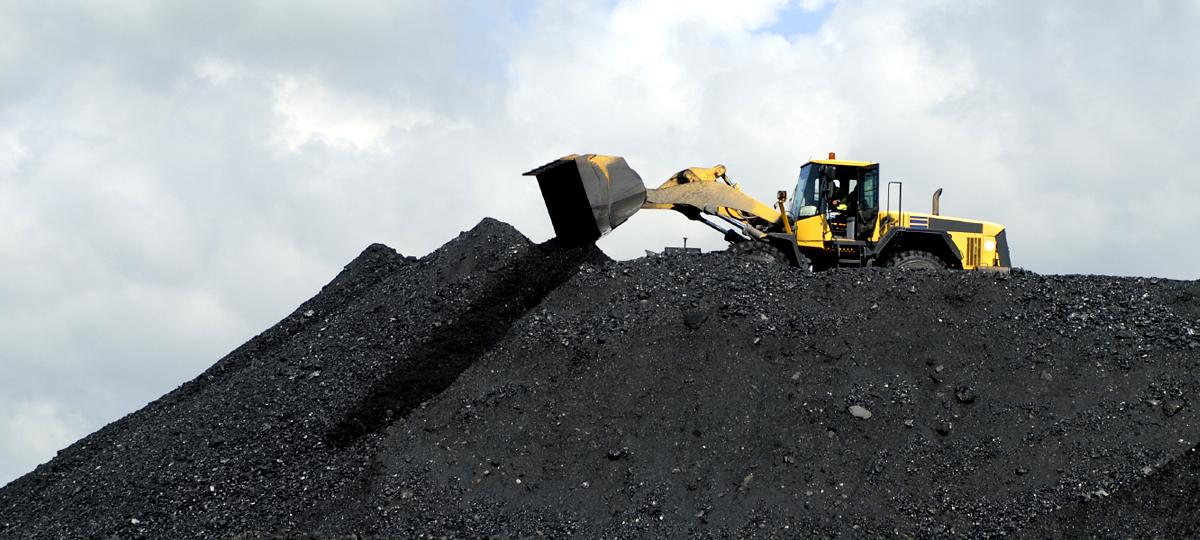
Coal mining
Over the past several decades, there has been a gradual shift from underground coal mining to surface mining in the United States. Surface mining, which is only effective for shallow deposits, often employs highly invasive techniques, including area strip mining and mountaintop removal.
Underground mining
The most obvious and severe cost of underground coal mining is the threat it poses to the health and safety of coal miners. Many coal miners are injured, sometimes fatally, on the job each year; according to the Mine Safety and Health Administration, fatalities at underground coal mine sites in the United States totaled 77 from 2010 to 2013, including a 2010 explosion at the Upper Big Branch coal mine in West Virginia that killed 29 miners [1, 2].
In addition to job site accidents, coal mining can lead to chronic health disorders. Black lung disease (pneumoconiosis) continues to be a common ailment among coal miners. The disease was responsible for the deaths of approximately 10,000 former miners between 1990 and 2000, and continues today [3].
Adverse impacts to the environment are another significant cost of underground coal mining. Mines can collapse or gradually subside, affecting surface and subsurface water flows. Mine fires also occur, particularly in abandoned mines. And acid mine drainage at underground coal mines can be a long term environmental management issue; according to the US Environmental Protection Agency (EPA), if active and abandoned coal mines are not properly managed, water can sometimes flow through the mine and become highly acidic and rich in heavy metals. The resulting drainage water is detrimental to human, plant, and animal life [4].
Surface mining
Surface mining involves removing the overlaying soil to access the coal below, devastating local environments. Mountaintop removal, a particularly destructive form of surface mining, involves stripping all trees and other vegetation from peaks and hilltops, and then blasting away hundreds of feet of the earth below with explosives.
More than 500 mountaintop removal sites exist throughout the Appalachia region, impacting nearly 1.4 million acres of land [5].
The process results in both short- and long-term environmental impacts. In the short term, huge volumes of excess rock and soil are typically dumped into adjacent valleys and streams, altering their ecosystems and diverting the natural flow of streams.
In the long term, coal removal sites are left with poor soil that typically only supports exotic grasses. Buried valleys are similarly slow to rebound. The EPA reports that as of 2010, mountaintop removal coal extraction had buried nearly 2,000 miles of Appalachian headwater streams, some of the most biologically diverse streams in the country [6].
Surface mining can also directly impact the health and safety of surrounding communities. Mudslides, landslides, and flashfloods may become more common. And depending on the chemical makeup of the coal deposit, mines can pollute local drinking water sources with toxic chemicals like selenium, arsenic, manganese, lead, iron, and hydrogen sulfide [7].
A Harvard University study, which assessed the life cycle costs and public health effects of coal from 1997 to 2005, found a link to lung, cardiovascular, and kidney diseases—such as diabetes and hypertension—and an elevated occurrence of low birth rate and preterm births associated with surface mining practices. The total cost? An estimated $74.6 billion every year, equivalent to 4.36 cents per kilowatt-hour of electricity produced—about one-third of the average electricity rate for a typical US home [8].
Oil and gas drilling
The environmental and health costs of onshore and offshore oil and gas drilling are also significant, and often unseen. The impacts of unconventional extraction methods, such as natural gas hydraulic fracturing (commonly called fracking) have received much attention, but all methods of oil and gas extraction carry hidden costs.
Water impact
When oil and gas are extracted, water that had been trapped in the geologic formation is brought to the surface. This “produced water” can carry with it naturally-occurring dissolved solids, heavy metals, hydrocarbons, and radioactive materials in concentrations that make it unsuitable for human consumption and difficult to dispose of safely [9].
When hydraulic fracturing methods are used, the total amount of waste water is amplified by the large volume of water and chemicals involved in the process. Drilling and fracking shale gas formations (like the Marcellus Shale) typically requires 3 to 6 million gallons of water per well, and an additional 15,000-60,000 gallons of chemicals, many of which are undisclosed to Federal regulators [10, 11]. One government-sponsored report found that, from 2005 to 2009, 14 oil and gas companies used 780 million gallons of hydraulic fracturing products containing 750 chemicals and other components [12]. Another study identified 632 chemicals contained in fracking products used in shale gas extraction.
Researchers could track only 353 chemicals from that larger list and found that 25 percent of those chemicals cause cancer or other mutations, and about half could severely damage neurological, cardiovascular, endocrine, and immune systems [13].
Land use
A large amount of land is disturbed by the drilling wells, access roads, processing facilities, and pipelines associated with oil and gas drilling operations. In particular, noise and habitat fragmentation can harm wildlife populations. For example: one study found an 82 percent decline in the population of Powder River Basin sage grouse between 2001 and 2005, which was directly linked to the area’s coal bed methane production [14].
The advent of horizontal drilling technology, used extensively in unconventional gas production, has greatly reduced the surface footprint of drilling operations by allowing multiple wells to be drilled from a single well pad. However, much of the development of the US shale gas resources is occurring in locations where oil and gas production has not previously taken place (in some cases in wilderness areas), requiring extensive infrastructure development and land degradation [15].
Global warming emissions
Natural gas’s climate emissions are not only generated when it’s burned as a fuel at power plants or in our homes. The full global warming impact of natural gas also includes methane emissions from drilling wells and pipeline transportation.
Methane, the main component of natural gas, is a much more potent greenhouse gas than carbon dioxide—some 34 times more effective at trapping heat over a 100-year timescale and 86 times more effective over a 20-year timescale [16]. Preliminary studies and field measurements show that these so-called “fugitive” emissions range from 1 to 9 percent of total natural gas lifecycle emissions. Methane losses must be kept below 3.2 percent for natural gas power plants to have lower lifecycle greenhouse gas emissions than coal [17].
Oil drilling can also produce methane. Although it can be captured and used as an energy source, the gas is often either vented (released) or flared (burned). Vented methane contributes greatly to global warming, and poses a serious safety hazard. Flaring the gas converts it from methane to carbon dioxide, which reduces its impact but still releases additional greenhouse gases to into the atmosphere. The World Bank estimates that 5.3 trillion cubic feet of natural gas, the equivalent of 25 percent of total US consumption, is flared annually worldwide, generating some 400 million tons of unnecessary carbon dioxide emissions [18].
Offshore drilling
Offshore oil and gas drilling poses many of the same risks as onshore drilling; however, these risks are amplified due to the remote location of offshore drilling sites and the complicated engineering required. In 2010, an explosion at the Deepwater Horizon offshore oil rig in the Gulf of Mexico killed 11 workers and led to the release of approximately 4.9 million barrels of oil over 87 days [19]. The accident was unique in terms of its scale, but environmental and safety incidents are common in the offshore oil and gas industries. Between 2008 and 2012, offshore drilling rigs experienced 34 fatalities, 1,436 injuries, and 60 oils spills of more than 50 barrels each [20].
Unconventional sources
As easily-accessed sources of oil dry up, so-called “new” sources of oil are introducing new problems. For example, tar sands—an extremely viscous oil with the consistency of peanut butter—requires significantly more energy to mine and refine, emitting up to three times more greenhouse gas emissions than conventional oil in the process. These and other additional emissions mean that the dirtiest sources of oil can add as much as an extra ton of pollution per year for the average car.
Transporting fossil fuels
Depending on where fossil fuels are extracted and used, the resource itself may need to travel across long distances—but transporting fuel can generate its own pollution, and increase the potential for catastrophic accidents.
Coal
In most cases, coal is transported from mines to power plants. In 2014, approximately 68 percent of the coal used for electric power in the US was transported by rail: 13 percent was transported on river barge and another 11 percent by truck [21]. Train cars, barges, and trucks all run on diesel fuel, a major source of nitrogen dioxide and soot, which carry substantial human health risks [22]. Transporting coal can also produce coal dust, which presents serious cardiovascular and respiratory risks for communities near transportation routes [23].
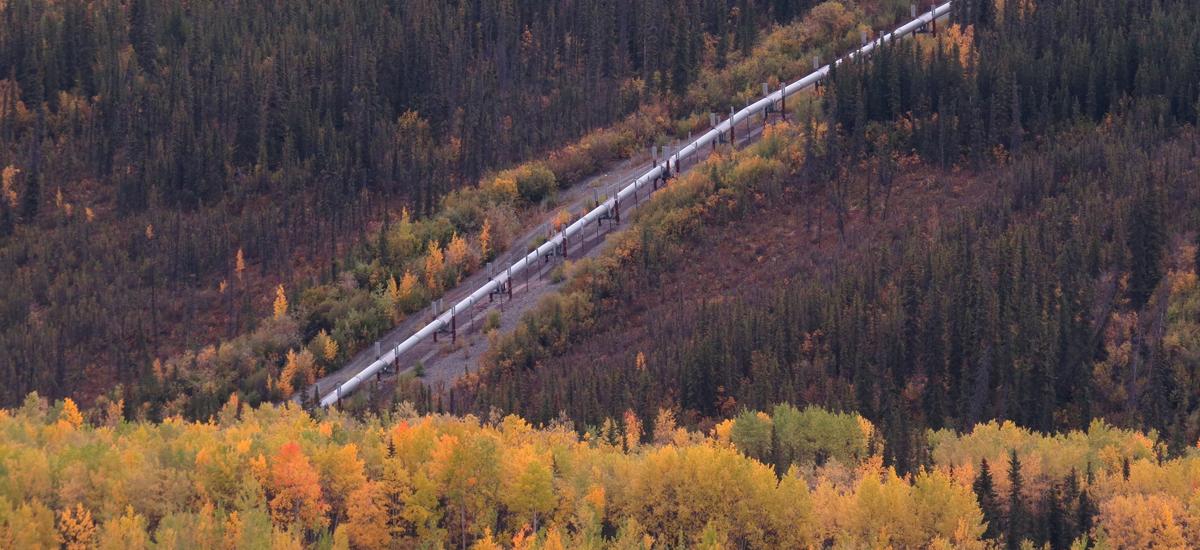
Natural gas
Natural gas is transported over long distances by transmission pipelines, while distribution pipelines deliver gas locally to homes and businesses. But natural gas is also highly flammable, making the process of transporting it from wellhead to homes and businesses dangerous. Between 2008 and 2015, there were 5,065 significant safety incidents related to natural gas pipeline transmission and distribution, leading to 108 fatalities and 531 injuries [24].
In addition to safety concerns, natural gas leaks from transmission and distribution pipelines are a significant source of methane emissions. A recent study, which mapped urban pipeline leaks in Boston, found 3,356 separate leaks under the city streets. The study noted that Boston is not unique; other cities, like New York and Washington DC, have aging natural gas distribution infrastructures, and similar methane leaks are likely widespread [25].
Large leaks from natural gas infrastructure also occur. Beginning in 2015, the Southern California Gas Company's Aliso Canyon natural gas storage facility was the site of the largest methane leak in US history, with a total of 94,500 tons of methane was released between October 23, 2015 and February 11, 2016 [26, 27].
Liquefied Natural Gas (LNG) is natural gas that has been cooled and condensed into a liquid form. As of 2016, there were 13 LNG import/export terminals in the United States [28]. The growth in LNG shipments has provoked safety concerns, particularly where LNG terminals are situated near densely settled areas. In the wake of the Sept. 11, 2001, terrorist attacks, LNG deliveries have faced tight security and stricter regulations as policy makers have debated the risks of an attack on LNG facilities or ships [29].
Oil
Oil is transported across the ocean in supertankers, and it is moved over land by pipeline, rail, and truck. In every case, the risk of oil spills poses a serious environmental threat.
The infamous 1989 Exxon Valdez oil spill released 262,000 barrels of oil into the Prince Williams Sound in Alaska, but was only the 35th largest marine oil tanker spill since 1967. While major oil spills have decreased, they still occur: three large oil spills released more than 5,000 barrels of oil each in 2013 alone [30, 31].
Spills and leaks from onshore oil pipelines also continue to be a major risk. Examples of recent pipeline spills in the US include the 2010 Enbridge spill that released approximately 20,100 barrels into Michigan’s Kalamazoo River and the 2011 ExxonMobil spill that released some 1,000 barrels of oil into Montana’s Yellowstone River [32, 33].
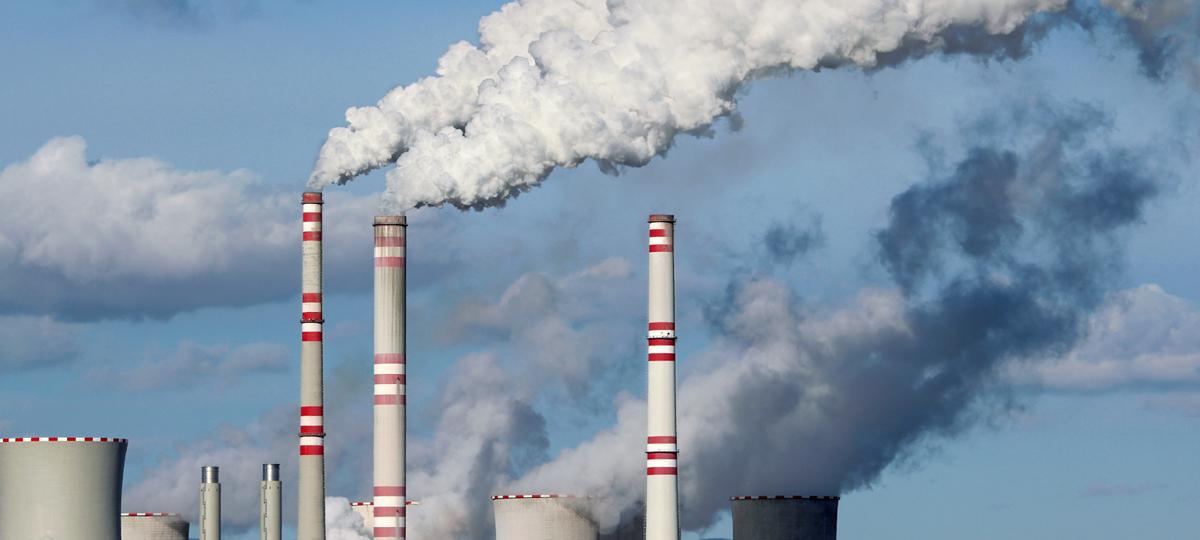
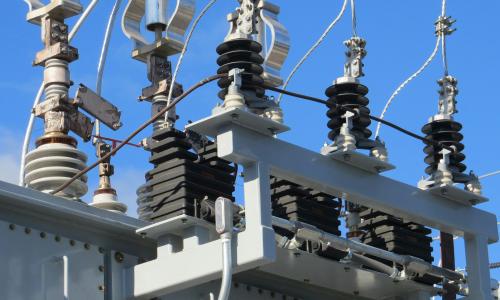
Burning fossil fuels
Some of the most significant hidden costs of fossil fuels are from the air emissions that occur when they are burned. Unlike the extraction and transport stages, in which coal, oil, and natural gas can have very different types of impacts, all fossil fuels emit carbon dioxide and other harmful air pollutants when burned. These emissions lead to a wide variety of public health and environmental costs that are borne at the local, regional, national, and global levels.
Global warming emissions
Of the many environmental and public health risks associated with burning fossil fuels, the most serious in terms of its universal and potentially irreversible consequences is global warming. In 2014, approximately 78 percent of US global warming emissions were energy-related emissions of carbon dioxide. Of this, approximately 42 percent was from oil and other liquids, 32 percent from coal, and 27 percent from natural gas [34].
Non-fossil fuel energy generation technologies, like wind, solar, and geothermal, contributed less than 1 percent of the total energy related global warming emissions. Even when considering the full lifecycle carbon emissions of all energy sources, coal, oil, and natural gas clearly stand out with significantly higher greenhouse gas emissions [35].
The use of fossil fuels in transportation contributes almost 30 percent of all US global warming emissions, rivalling—and likely to surpass—the power sector [36].
Air pollution
Burning fossil fuels emits a number of air pollutants that are harmful to both the environment and public health.
Sulfur dioxide (SO2) emissions, primarily the result of burning coal, contribute to acid rain and the formation of harmful particulate matter. In addition, SO2 emissions can exacerbate respiratory ailments, including asthma, nasal congestion, and pulmonary inflammation [37]. In 2014, fossil fuel combustion at power plants accounted for 64 percent of US SO2 emissions [38].
Nitrogen oxides (NOx) emissions, a byproduct of all fossil fuel combustion, contribute to acid rain and ground-level ozone (smog), which can burn lung tissue and can make people more susceptible to asthma, bronchitis, and other chronic respiratory diseases. Fossil fuel-powered transportation is the primary contributor to US NOx emissions [39].
Acid rain is formed when sulfur dioxide and nitrogen oxides mix with water, oxygen, and other chemicals in the atmosphere, leading to rain and other precipitation that is mildly acidic. Acidic precipitation increases the acidity of lakes and streams, which can be harmful to fish and other aquatic organisms. It can also damage trees and weaken forest ecosystems [40].
Particulate matter (soot) emissions produce haze and can cause chronic bronchitis, aggravated asthma, and elevated occurrence of premature death. In 2010, it is estimated that fine particle pollution from US coal plants resulted in 13,200 deaths, 9,700 hospitalizations, and 20,000 heart attacks. The impacts are particularly severe among the young, the elderly, and those who suffer from respiratory disease. The total health cost was estimated to be more than $100 billion per year [41].
Coal-fired power plants are the largest source of mercury emissions to the air in the United States [42, 43]. As airborne mercury settles onto the ground, it washes into bodies of water where it accumulates in fish, and subsequently passes through the food chain to birds and other animals. The consumption of mercury-laden fish by pregnant women has been associated with neurological and neurobehavioral effects in infants. Young children are also at risk [44].
A number of studies have sought to quantify the health costs associated with fossil fuel-related air pollution. The National Academy of Sciences assessed the costs of SO2, NOx, and particulate matter air pollution from coal and reported an annual cost of $62 billion for 2005 —approximately 3.2 cents per kilowatt-hour (kWh) [45]. A separate study estimated that the pollution costs from coal combustion, including the effects of volatile organic compounds (VOCs) and ozone, was approximately $187 billion annually, or 9.3 cents per kWh [46].
A 2013 study also assessed the economic impacts of fossil fuel use, including illnesses, premature mortality, workdays lost, and direct costs to the healthcare system associated with emissions of particulates, NOx, and SO2. This study found an average economic cost (or “public health added cost”) of 32 cents per kWh for coal, 13 cents per kWh for oil, and 2 cents per kWh for natural gas [47]. While cost estimates vary depending on each study’s scope and assumptions, together they demonstrate the significant and real economic costs that unpriced air emissions impose on society.
Fossil fuel transportation emissions represent the largest single source of toxic air pollution in the U.S., accounting for over a third of carbon monoxide (CO) and NOx emissions.
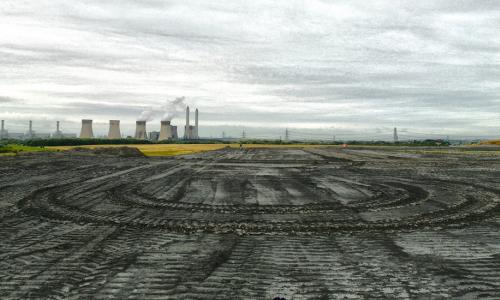
Water use
Across the United States, the demand for electricity is colliding with the need for healthy and abundant freshwater. Nationwide, fossil fuel and nuclear power plants have been found to withdraw as much water as all farms and more than four times as much as all residences. More than 80 percent of this power plant cooling water originates in lakes and rivers, directly impacting local ecosystems and often competing with other uses, such as agriculture and recreation. As of 2008, about 20 percent of U.S. watersheds were experiencing water-supply stress. Power plants substantially contributed to the water stress in one-fifth of these watersheds [48].
Power plants that return water to nearby rivers, lakes, or the ocean can harm wildlife through what is known as “thermal pollution.” Thermal pollution occurs due to the degradation of water quality resulting from changes in water temperature. Some power plants have large impacts on the temperature of nearby water sources, particularly coal plants with once-through cooling systems. For a typical 600-megawatt once-through system, 70 to 180 billion gallons of water cycle through the power plant before being released back into a nearby source. This water is much hotter (by up to 25°F) than when the water was initially withdrawn. Because this heated water contains lower levels of dissolved oxygen, its reintroduction to aquatic ecosystems can stress native wildlife, increasing heart rates in fish and decreasing fish fertility.
Fossil fuel waste
Although fossil fuels contain large amounts of energy, they’re rarely found in a pure, unadulterated state. Instead, they are typically refined and purified into a usable form, leaving excess waste material that requires disposal. The handling and disposal of this waste results in costly environmental and community health challenges.
Coal waste
Coal is known for being a dirty fuel, not just because of its high carbon content compared with other fossil fuels but also because it contains a large amount of toxic heavy metals and other chemicals.
If the coal contains high levels of sulfur—as does most coal from the eastern US—it must be cleaned and refined before it’s burned in a power plant. This process involves crushing and washing the coal to remove waste materials. The purified coal is then transported to its final destination, leaving behind coal slurry, a watery waste that contains arsenic, mercury, chromium, cadmium, and other heavy metals. As much as 50 percent of pre-processed coal materials can end up as highly toxic waste [49].
Others harmful materials remain as excess waste when the coal is burned. After combustion, the material left behind is known as coal ash, consisting of fly ash and bottom ash. Fly ash is the material that is captured by pollution control equipment in the coal plant’s smokestacks. If the plant does not have pollution control equipment, this waste is emitted directly as air pollution. Bottom ash is the substance that remains at the bottom of the furnace. Both fly ash and bottom ash contain large amounts of toxic heavy metals and require careful—and costly—disposal.
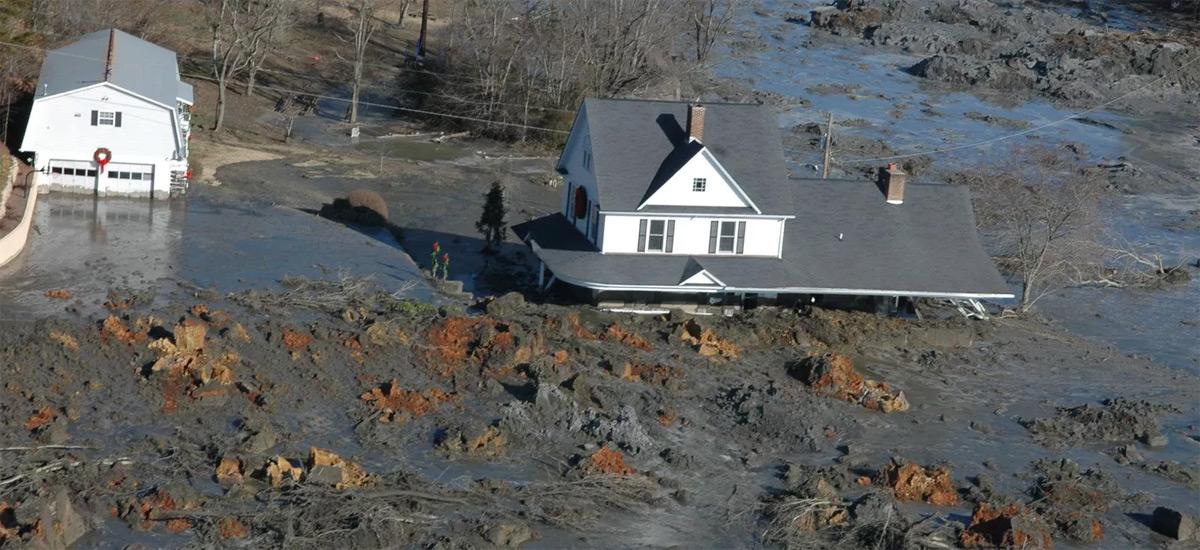
Coal slurry (pre-combustion waste) and coal ash (post-combustion waste) are stored in large reservoir impoundments. There are over a thousand coal slurry impoundments and coal ash waste sites in the US, many of which contain hundreds of millions of gallons of waste [50, 51].
If the reservoirs are unlined (as are at least 42 percent of US coal combustion waste ponds and landfills) or if lined reservoirs are not properly maintained, harmful chemicals can leach into surface and groundwater supplies. The presence of toxic heavy metals in drinking water has been found to cause cancer, birth defects, reproductive disorders, neurological damage, learning disabilities, and kidney disease [52].
The EPA has identified 53 coal ash ponds that are classified as a “high hazard”, meaning that a failure at one of these impoundments would cause serious property damage, injuries, illness, and death [53]. Over the last several decades, there have been several dozen spills at such reservoirs in Appalachia, including the 2000 Martin County Coal Company spill, the 2008 Tennessee Valley Authority spill, and the 2014 Duke Energy Dan River Spill [54].
Oil and gas wastewater
When oil and gas are extracted, water previously trapped within geologic formations is brought to the surface. This “produced water” can carry with it dissolved solids, heavy metals, hydrocarbons, and naturally occurring radioactive materials in quantities that make it unsuitable for human consumption and difficult to dispose of safely [55]. Extraction companies often temporarily store this water in open-air pits with impermeable liners to avoid seepage, but heavy rain can cause these pits to overflow. Covered holding tanks offer a more secure temporary storage option [56].
Oil and gas wastewater can also impact aquatic wildlife. Oil and grease leaked into water systems can adhere to fish and waterfowl and destroy algae and plankton, disrupting the primary food sources of fragile aquatic ecosystems. And heavy metals in the wastewater can be toxic to fish, even in low concentrations, and may be passed through the food chain, adversely affecting humans and larger animals [57].
The future of energy
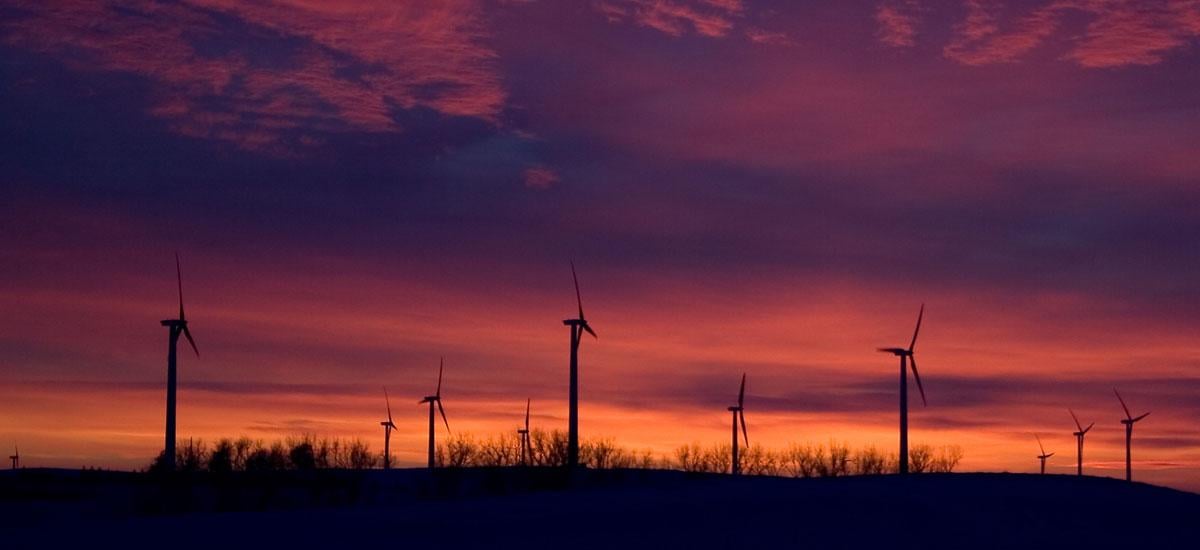
Burning coal, oil, and natural gas has serious and long-standing negative impacts on public health, local communities and ecosystems, and the global climate. Yet the majority of fossil fuel impacts are far removed from the fuels and electricity we purchase, hidden within public and private health expenditures, military budgets, emergency relief funds, and the degradation of sensitive ecosystems. We don’t pay for the cost of cancer, or the loss of fragile wetlands, when we pay our electricity bill—but the costs are real.
Renewable energy—such as wind and solar power—carries far fewer negative impacts at increasingly competitive prices. The Union of Concerned Scientists has worked for decades on transforming the electricity and transportation sectors, and is committed to policies and practices that encourage clean energy.
References
[1] Mine Safety and Health Administration (MSHA). 2013. Coal daily fatality report – year end 2013. Arlington, VA: U.S. Department of Labor. Online at http://www.msha.gov/stats/charts/coal2013yearend.asp, accessed on May 3, 2016.
[2] Mine Safety and Health Administration (MHSA). 2011. US Labor Department's MSHA cites corporate cuylture as root cause of Upper Big Branch Mine disaster. Press release, December 6. Washington, DC: U.S. Department of Labor. Online at http://www.msha.gov/MEDIA/PRESS/2011/NR111206.asp, accessed on May 3, 2016.
[3] Epstein, P.R.,J. J. Buonocore, K. Eckerle, M. Hendryx, B. M. Stout III, R. Heinberg, R. W. Clapp, B. May, N. L. Reinhart, M. M. Ahern, S. K. Doshi, and L. Glustrom. 2011. Full cost accounting for the life cycle of coal in “Ecological Economics Reviews.” Ann. N.Y. Acad. Sci. 1219: 73–98.
[4] Environmental Protection Agency (EPA). 2015. Abandoned mine drainage. Washington, DC. Online at https://www.epa.gov/polluted-runoff-nonpoint-source-pollution/abandoned-mine-drainage, accessed on May 3, 2016.
[5] Epstein, P.R.,J. J. Buonocore, K. Eckerle, M. Hendryx, B. M. Stout III, R. Heinberg, R. W. Clapp, B. May, N. L. Reinhart, M. M. Ahern, S. K. Doshi, and L. Glustrom. 2011. Full cost accounting for the life cycle of coal in “Ecological Economics Reviews.” Ann. N.Y. Acad. Sci. 1219: 73–98.
[6] Environmental Protection Agency (EPA). 2010. Memorandum: Improving EPA review of Appalachian surface coal mining operations under the Clean Water Act, National Environmental Policy Act, and the Environmental Justice Executive Order. Washington, DC. Online at: http://www.uky.edu/CommInfoStudies/IRJCI/MTRguidance.pdf, accessed on May 3, 2016.
[7] Holzman, D. C. 2011. Mountaintop removal mining: Digging into community health concerns. Environmental Health Perspectives.119(11): a476–a483. Online here, accessed on May 3, 2016.
[8] Epstein, P.R.,J. J. Buonocore, K. Eckerle, M. Hendryx, B. M. Stout III, R. Heinberg, R. W. Clapp, B. May, N. L. Reinhart, M. M. Ahern, S. K. Doshi, and L. Glustrom. 2011. Full cost accounting for the life cycle of coal in “Ecological Economics Reviews.” Ann. N.Y. Acad. Sci. 1219: 73–98.
[9] Environmental Protection Agency (EPA). 2015. TENORM: Oil and gas production wastes. Washington, DC. Online at https://www.epa.gov/radiation/tenorm-oil-and-gas-production-wastes, accessed on May 3, 2016.
[10] National Energy Technology Laboratory (NETL). Modern shale gas development in the United States: An update. Pittsburgh, PA: U.S. Department of Energy. Online at http://www.netl.doe.gov/File%20Library/Research/Oil-Gas/shale-gas-primer-update-2013.pdf, accessed on May 3, 2016.
[11] Environmental Protection Agency (EPA). 2011. Plan to study the potential impacts of hydraulic fracturing on drinking water resources, EPA/600/R-11/122. Washington, DC. Online at https://www.epa.gov/sites/production/files/documents/hf_study_plan_110211_final_508.pdf, accessed on May 3, 2016.
[12] U.S. House of Representatives, Committee on Energy and Commerce, Minority Staff. 2011. Chemicals used in hydraulic fracturing. Prepared by committee staff for Henry A. Waxman, Edward J. Markey, and Diana DeGette. Online here, accessed on May 3, 2016.
[13] Colborn, T., C. Kwiatkowski, K. Schultz, and M. Bachran. 2011. Natural gas operations from a public health perspective. Human and Ecological Risk Assessment: An International Journal 17(5):1039–1056. Online at here, accessed on May 3, 2016.
[14] Taylor, R. L. et al. 2012. Viability analyses for conservation of sage-grouse populations. Prepared for the U.S. Bureau of Land Management. Online at http://www.powderriverbasin.org/assets/Uploads/files/cbm-studies/PVA-Sage-Grouse-FinalReport.pdf, accessed on May 3, 2016.
[15] Allred, B.W., W.K. Smith, D. Twidwell, J.H. Haggerty, S.W. Running, D.E. Naugle, and S.D. Fuhlendorf. 2015. Ecosystem services lost to oil and gas in North America. Science 348(6233): 401-402.
[16] Myhre, G., D. Shindell, F.-M. Bréon, W. Collins, J. Fuglestvedt, J. Huang, D. Koch, J.-F. Lamarque, D. Lee, B. Mendoza, T. Nakajima, A. Robock, G. Stephens, T. Takemura and H. Zhang, 2013: Anthropogenic and Natural Radiative Forcing. In: Climate Change 2013: The Physical Science Basis. Contribution of Working Group I to the Fifth Assessment Report of the Intergovernmental Panel on Climate Change http://www.climatechange2013.org/images/report/WG1AR5_Chapter08_FINAL.pdf, accessed on May 3, 2016.
[17] Alvarez, R.A., S.W. Pacala, J.J. Winebrake, W.L. Chameides, and S.P. Hamburg. Greater focus needed on methane leakage from natural gas. PNAS 109(17): 6435-6440.
[18] Global Gas Flaring Reduction Partnership (GGFR). Global Gas Flaring Reduction Partnership (GGFR): Improving energy efficiency & mitigating impact on climate change. Washington, DC: The World Bank. Online here, accessed on May 3, 2016.
[19] On-Scene Coordinator (OSC). 2011. On scene coordinator report: Deepwater Horizon Oil Spill. Washington, DC: National Response Team. Online at http://www.uscg.mil/foia/docs/dwh/fosc_dwh_report.pdf, accessed on May 3, 2016.
[20] Bureau of Safety and Environmental Enforcement (BSEE). 2015. Incident statistics summaries. Washington, DC: U.S. Department of the Interior. Online at http://www.bsee.gov/Inspection-and-Enforcement/Accidents-and-Incidents/Listing-and-Status-of-Accident-Investigations, accessed on May 3, 2016.
[21] Energy Information Administration (EIA). Annual coal distribution report. Washington, DC: U.S. Department of Energy. Online at: http://www.eia.gov/coal/distribution/annual/, accessed on May 3, 2016.
[22] Massachusetts Department of Environmental Protection (MassDEP). Health & Environmental Effects of Diesel Pollution.” Boston, MA. Online at: http://www.mass.gov/eea/agencies/massdep/air/grants/health-and-environmental-effects-of-diesel-pollution.html, accessed on May 3, 2016.
[23] Epstein, P.R.,J. J. Buonocore, K. Eckerle, M. Hendryx, B. M. Stout III, R. Heinberg, R. W. Clapp, B. May, N. L. Reinhart, M. M. Ahern, S. K. Doshi, and L. Glustrom. 2011. Full cost accounting for the life cycle of coal in “Ecological Economics Reviews.” Ann. N.Y. Acad. Sci. 1219: 73–98.
[24] Pipeline and Hazardous Materials Safety Administration. Pipeline incident 20 year trend. Washington, DC: U.S. Department of Transportation. Online at https://hip.phmsa.dot.gov/analyticsSOAP/saw.dll?Portalpages, accessed on May 3, 2016.
[25] Boston University (BU). 2012. Study details natural gas leaks in Boston. Boston, MA. November 20. Online at http://www.bu.edu/cas/2012/11/20/thousands-of-natural-gas-leaks-discovered-in-boston/, accessed on May 3, 2016.
[26] Babson, D. 2016. It's the largest methane leak in U.S. history. Who's responsible? The Equation. Cambridge, MA: Union of Concerned Scientists. Online athttp://blog.ucsusa.org/david-babson/porter-ranch-methane-leak-responsible, accessed July 10, 2016.
[27] California Air Resources Board (CARB). 2016. Aliso Canyon natural gas leak. Sacramento, CA: California Environmental Protection Agency. Online at http://www.arb.ca.gov/research/aliso_canyon_natural_gas_leak.htm, accessed on July 10, 2016.
[28] Federal Energy Regulatory Commission (FERC). 2016. North American LNG import/export terminals, existing. Washington, DC: U.S. Department of Energy. Online at http://www.ferc.gov/industries/gas/indus-act/lng/lng-existing.pdf, accessed on May 3, 2016.
[29] Kaplan, Eben. 2006. Liquefied natural gas: A potential terrorist target? Washington, DC: Council on Foreign Relations. Online at http://www.cfr.org/natural-gas/liquefied-natural-gas-potential-terrorist-target/p9810, accessed on May 3, 2016.
[30] International Tankers Owners Pollution Federation (ITOPF). 2013. Oil tanker spill statistics 2013. London, UK. Online at http://www.itopf.com/fileadmin/data/Documents/Company_Lit/OilSpillstats_2013.pdf, accessed on May 3, 2016.
[31] International Tankers Owners Pollution Federation (ITOPF). 2015. Oil tanker spill statistics 2015. London, UK. http://www.itopf.com/knowledge-resources/data-statistics/statistics/, accessed on May 3, 2016.
[32] Environmental Protection Agency (EPA). 2015. EPA's response to the Enbridge oil spill. Washington, DC. Online at http://www.epa.gov/enbridgespill/index.html, accessed on May 3, 2016.
[33] Environmental Protection Agency (EPA). 2011. EPA update on Yellowstone River oil spill (Silvertip Pipeline). Press release, July 20. Online here, accessed on May 3, 2016.
[34] Energy Information Administration (EIA). 2015. U.S. energy-related carbon dioxide emissions, 2014. Washinton, DC: U.S. Department of Energy. Online at http://www.eia.gov/environment/emissions/carbon/, accessed on July 10, 2016.
[35] IPCC, 2011: Summary for Policymakers. In: IPCC Special Report on Renewable Energy Sources and Climate Change Mitigation [O. Edenhofer, R. Pichs-Madruga, Y. Sokona, K. Seyboth, P. Matschoss, S. Kadner, T. Zwickel, P. Eickemeier, G. Hansen, S. Schlömer, C. von Stechow (eds)], Cambridge University Press, Cambridge, United Kingdom and New York, NY, USA. Online at http://www.ipcc.ch/report/srren/, accessed on May 3, 2016.
[36] Energy Information Administration (EIA). 2016. Monthly energy review. Washington, DC: U.S. Department of Energy. Online at: http://www.eia.gov/totalenergy/data/monthly/, accessed on July 10
[37] Epstein, P.R.,J. J. Buonocore, K. Eckerle, M. Hendryx, B. M. Stout III, R. Heinberg, R. W. Clapp, B. May, N. L. Reinhart, M. M. Ahern, S. K. Doshi, and L. Glustrom. 2011. Full cost accounting for the life cycle of coal in “Ecological Economics Reviews.” Ann. N.Y. Acad. Sci. 1219: 73–98.
[38] Environmental Protection Agency (EPA). 2016. Air pollution emissions trends data. Washington, DC. Online at: https://www.epa.gov/air-emissions-inventories/air-pollutant-emissions-trends-data, accessed on July 10, 2016.
[39] Environmental Protection Agency (EPA). 2016. Nitrogen oxides (NOx) control regulations. Washington, DC. Online at: http://www.epa.gov/region1/airquality/nox.html, accessed on May 3, 2016.
[40] Environmental Protection Agency (EPA). 2016. Acid rain. Washington, DC. Online at: http://www.epa.gov/acidrain/, accessed on May 3, 2016.
[41]Schneider, C., and J. Banks. 2010. The toll of coal: An updated assessment of death and disease from America's dirtiest energy source. Boston, MA: Clean Air Task Force. Online at at: http://www.catf.us/resources/publications/files/The_Toll_from_Coal.pdf, accessed on May 3, 2016.
[42] Environmental Protection Agency. 2016. Cleaner power plants. Washington, DC. Online at https://www3.epa.gov/mats/powerplants.html, accessed on May 3, 2016.
[43] Environmental Protection Agency (EPA). 2010. Memorandum: Improving EPA review of Appalachian surface coal mining operations under the Clean Water Act, National Environmental Policy Act, and the Environmental Justice Executive Order. Washington, DC. Online at: http://www.uky.edu/CommInfoStudies/IRJCI/MTRguidance.pdf, accessed on May 3, 2016.
[44] Epstein, P.R.,J. J. Buonocore, K. Eckerle, M. Hendryx, B. M. Stout III, R. Heinberg, R. W. Clapp, B. May, N. L. Reinhart, M. M. Ahern, S. K. Doshi, and L. Glustrom. 2011. Full cost accounting for the life cycle of coal in “Ecological Economics Reviews.” Ann. N.Y. Acad. Sci. 1219: 73–98.
[45] National Research Council. 2010. Hidden costs of energy: Unpriced consequences of energy production and use. Washington, DC: The National Academies Press. Online at http://www.nap.edu/catalog/12794/hidden-costs-of-energy-unpriced-consequences-of-energy-production-and, accessed on May 3, 2016.
[46] Epstein, P.R.,J. J. Buonocore, K. Eckerle, M. Hendryx, B. M. Stout III, R. Heinberg, R. W. Clapp, B. May, N. L. Reinhart, M. M. Ahern, S. K. Doshi, and L. Glustrom. 2011. Full cost accounting for the life cycle of coal in “Ecological Economics Reviews.” Ann. N.Y. Acad. Sci. 1219: 73–98.
[47] Machol, Rizk. “Economic value of U.S. fossil fuel electricity health impacts.” Environment International 52 (2013) 75–80.
[48] Freshwater Use by U.S. Power Plants: Electricity’s Thirst For a Precious Resource. Union of Concerned Scientists. 2011. Available at: http://www.ucsusa.org/assets/documents/clean_energy/ew3/ew3-freshwater-use-by-us-power-plants-exec-sum.pdf
[49] National Research Council. 2010. Hidden costs of energy: Unpriced consequences of energy production and use. Washington, DC: The National Academies Press. Online at http://www.nap.edu/catalog/12794/hidden-costs-of-energy-unpriced-consequences-of-energy-production-and, accessed on May 3, 2016.
[50] Eilperin, J., and S. Mufson. 2013. Many coal sludge impoundments have weak walls, federal study says. Washington Post, April 24. Online at http://www.washingtonpost.com/national/health-science/many-coal-sludge-impoundments-have-weak-walls-federal-study-says/2013/04/24/76c5be2a-acf9-11e2-a8b9-2a63d75b5459_story.html, accessed on May 3, 2016.
[51] Environmental Protection Agency (EPA). 2015. Final rule: Disposal of coal combustion residuals from electric utilities. Washington, DC. Online at https://www.epa.gov/coalash/coal-ash-rule, access on May 3, 2016.
[52] Epstein, Paul R., et al. "Full cost accounting for the life cycle of coal." Annals of the New York Academy of Sciences 1219.1 (2011): 73-98. Available here: http://onlinelibrary.wiley.com/doi/10.1111/j.1749-6632.2010.05890.x/pdf
[53] Environmental Protection Agency (EPA). 2015. Final rule: Disposal of coal combustion residuals from electric utilities. Washington, DC. Online at https://www.epa.gov/coalash/coal-ash-rule, access on May 3, 2016.
[54] Epstein, P.R.,J. J. Buonocore, K. Eckerle, M. Hendryx, B. M. Stout III, R. Heinberg, R. W. Clapp, B. May, N. L. Reinhart, M. M. Ahern, S. K. Doshi, and L. Glustrom. 2011. Full cost accounting for the life cycle of coal in “Ecological Economics Reviews.” Ann. N.Y. Acad. Sci. 1219: 73–98.
[55] National Research Council. 2010. Hidden costs of energy: Unpriced consequences of energy production and use. Washington, DC: The National Academies Press. Online at http://www.nap.edu/catalog/12794/hidden-costs-of-energy-unpriced-consequences-of-energy-production-and, accessed on May 3, 2016.
[56] Zoback, M., S. Kitasei, and B. Copithorne. 2010. Beneath the surface: A survey of environmental risks from shale gas development. Washington, DC: WorldWatch Institute. Online at http://www.worldwatch.org/node/6474, accessed on May 3, 2016.
[57] National Research Council. 2010. Hidden costs of energy: Unpriced consequences of energy production and use. Washington, DC: The National Academies Press. Online at http://www.nap.edu/catalog/12794/hidden-costs-of-energy-unpriced-consequences-of-energy-production-and, accessed on May 3, 2016.
Related resources
State Electric Vehicle Benefits

Feet To The Fire
Siting for a Cleaner, More Equitable Grid in Massachusetts