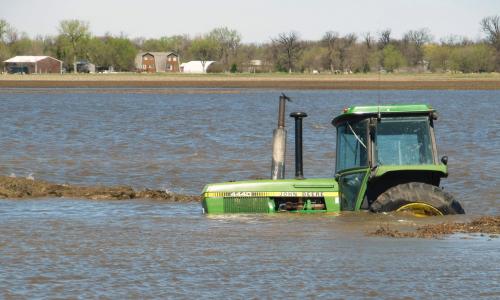
These maps compare areas at risk of flooding with two different COVID-19 scenarios between now (April 13, 2020) and May 16.
In the first scenario, social contact within each county decreases by an additional 20 percent each week until the number of cases in that county starts to decrease.
In the second scenario, social contact decreases by 40 percent every week until cases decrease.
Two social distancing scenarios
The modest reduction in social contact in the first scenario would ultimately result in more than 600,000 cases of COVID-19 in the counties that also carry a risk of moderate or major flooding.
The second scenario results in roughly 170,000 cases of COVID-19 in areas also at risk of flooding—a reduction of more than two-thirds.
Report
Coronavirus and Flooding in the United States
In regions facing significant flooding, strong social distancing measures could reduce the total number of COVID-19 cases by more than two-thirds.
Related resources
Report
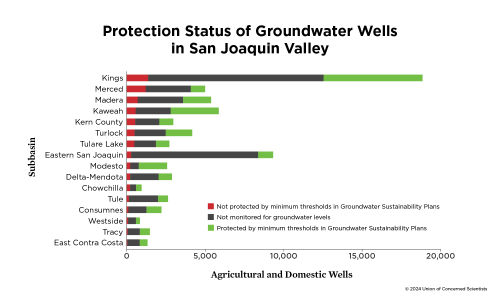
Understanding Future Groundwater Sustainability Scenarios
Understanding the future of groundwater sustainability, including sustainability in diverse climate change scenarios, is crucial for low-income and farmworker communities.
Podcast

Earth Day Two Ways
Jess hosts a conversation between climate scientist Dr. Brenda Ekwurzel and environmentalist and actor Eric Balfour about climate solutions and the future of humanity and our planet.
Activist Resource
Scientist Community Partnerships
Scientist-community partnerships can help level the playing field for communities that are being shut out of important policy discussions, and UCS is taking an active role in fostering these collaborations.
Podcast

Feet To The Fire
Jess talks with California's Attorney General Rob Bonta about a historic lawsuit he filed against Big Oil.