Wildfires are increasing, wildfire season is getting longer, and climate change is playing a significant role.
View an updated version of this infographic here.
Panel 1: Wildfires and wildfire season
- The number of large wildfires — defined as those covering more than 1,000 acres — is increasing throughout the region. Over the past 12 years, every state in the Western U.S. has experienced an increase in the average number of large wildfires per year compared to the annual average from 1980 to 2000.
- Wildfire season is generally defined as the time period between the year’s first and last large wildfires. This infographic highlights the length of the wildfire season for the Western U.S. as a region. Local wildfire seasons vary by location, but have almost universally become longer over the past 40 years.
Panel 2: Rising temperatures and earlier snowmelt
- Temperatures are increasing much faster in the Western U.S. than for the planet as a whole. Since 1970, average annual temperatures in the Western U.S. have increased by 1.9° F, about twice the pace of the global average warming.
- Scientists are able to gauge the onset of spring snowmelt by evaluating streamflow gauges throughout the Western U.S. Depending on location, the onset of spring snowmelt is occurring 1-4 weeks earlier today than it did in the late 1940s.
Panel 3: Future projections
- The projected increase in annual burn area varies depending on the type of ecosystem. Higher temperatures are expected to affect certain ecosystems, such as the Southern Rocky Mountain Steppe-Forest of central Colorado, more than others, such as the semi-desert and desert of southern Arizona and California. Every ecosystem type, however, is projected to experience an increase in average annual burn area.
- The range of projected temperature increases in the Western U.S. by mid-century (2040 – 2070) represents a choice of two possible futures — from one in which we drastically reduce heat-trapping emissions (the projected low end of a lower emissions pathway) to a future in which we continue with "business as usual" (the projected high end of a higher emissions pathway).
Methodology
The Western Wildfires and Climate Change infographic is based on careful evaluations of published scientific research and publicly accessible federal wildfire data.
Learn more about the methodology and assumptions behind the infographic.
Rights and permissions
You are free to use and post this infographic without alterations online, in written materials, and in presentations. We request that any online use includes proper citation and a link to this web page.
Related resources
Report
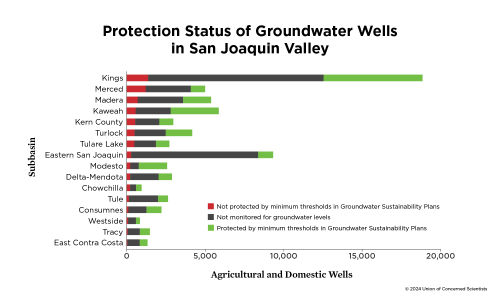
Understanding Future Groundwater Sustainability Scenarios
Understanding the future of groundwater sustainability, including sustainability in diverse climate change scenarios, is crucial for low-income and farmworker communities.
Podcast

Earth Day Two Ways
Jess hosts a conversation between climate scientist Dr. Brenda Ekwurzel and environmentalist and actor Eric Balfour about climate solutions and the future of humanity and our planet.
Podcast
Feet To The Fire
Jess talks with California's Attorney General Rob Bonta about a historic lawsuit he filed against Big Oil.
Activist Resource

The Science and Climate Litigation Webinar Series
Trainings, discussions, and case studies focused on the intersection of law, climate change, and science.