Seas are projected to rise between 3.7 and 6.1 feet over the course of this century in the area of Naval Station Mayport, which includes the coastal city of Jacksonville. This rise will greatly increase the area’s exposure to flooding.
During the second half of the century, in the absence of preventive measures, NS Mayport can expect more frequent and extensive tidal flooding, loss of currently utilized land, and substantial increases in the extent and severity of storm-driven flooding.
The US Military on the Front Lines of Rising Seas
Base information
This location is one of 18 military installations featured in the 2016 report, "The US Military on the Front Lines of Rising Seas."
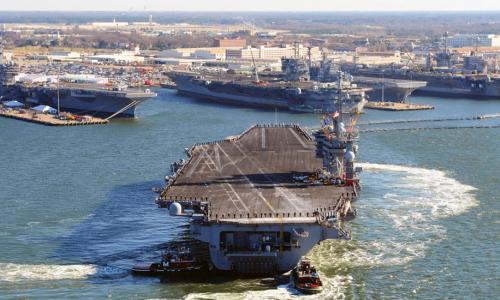
Naval Station Mayport is located 15 miles east of Jacksonville at the mouth of the St. Johns River. One of two major naval installations in the area, NS Mayport has a well-protected harbor that serves as a busy port.
The 3,409-acre station is home to the US Navy’s third-largest fleet. Its harbor can accommodate 34 ships, including aircraft carriers, and has an 8,000-foot runway that can handle almost all military aircraft. The station’s infrastructure has been valued at $1.3 billion.
NS Mayport is an integral part of Duval County’s community and economy. Over 15,000 active duty personnel and 32,000 family members live at NS Mayport, and the county itself is home to more than 85,000 veterans. Spending by the DOD drives more than $11 billion of gross regional product and provides 100,000 jobs.
Projected exposure to coastal flooding
The station's exposure to coastal flooding is projected for the years 2050, 2070, and 2100 based on the National Climate Assessment’s midrange or “intermediate-high” sea level rise scenario (referred to here as “intermediate”) and a “highest” scenario based on a more rapid rate of increase.
Tidal flooding, land loss, and storm surge from hurricanes were all modeled. In this analysis, land inundated by at least one high tide each day is considered a loss. This is a conservative metric: in reality, far less frequent flooding would likely lead to land being considered unusable.
The gap between the military’s current preparedness for sea level rise and the threats outlined here is large and growing.
In order to plan effectively for the long term, military decision makers with authority over NS Mayport need to understand how sea level rise may permanently alter the landscape of this coastal installation and where the threat of storm surge may become intolerable.
To take action, however, individual installations like NS Mayport will need more detailed analysis and resources to implement solutions.
Congress and the Department of Defense should, for example, support the development and distribution of high-resolution hurricane and coastal flooding models; adequately fund data monitoring systems such as our nation’s tide gauge network; allocate human, financial, and data resources to detailed mapping and planning efforts at military installations; and, as adaptive measures are identified, allocate resources for these projects, many of which will stretch over decades.
Our defense leadership has a special responsibility to protect the sites that hundreds of thousands of Americans depend on for their livelihoods and millions depend on for national security.
Additional maps and resources
This analysis modeled exposure to coastal flooding for four different points in time (2012, 2050, 2070, and 2100) and two different sea level rise scenarios.
For each time horizon and scenario, we analyzed storm surge from Category 1 through 5 hurricanes, the extent and frequency of flooding from extra-high tides, and inundation from ordinary high tides.
Detailed maps for each scenario at NS Mayport are available via Dropbox.
For more, please see the methodology used for this analysis.
Related resources
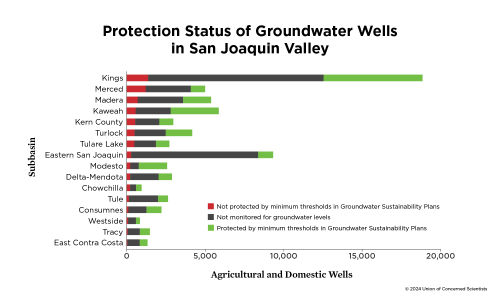
Understanding Future Groundwater Sustainability Scenarios

Earth Day Two Ways

Feet To The Fire