The globe is warming. In 2013, the Intergovernmental Panel on Climate Change (IPCC) concluded in its authoritative fifth assessment report that "Warming of the climate system is unequivocal, and since the 1950s, many of the observed changes are unprecedented over decades to millennia. The atmosphere and ocean have warmed, the amounts of snow and ice have diminished, sea level has risen, and the concentrations of greenhouse gases have increased". They also stated that “Human influence on the climate system is clear.”
How did they reach those sobering conclusions?
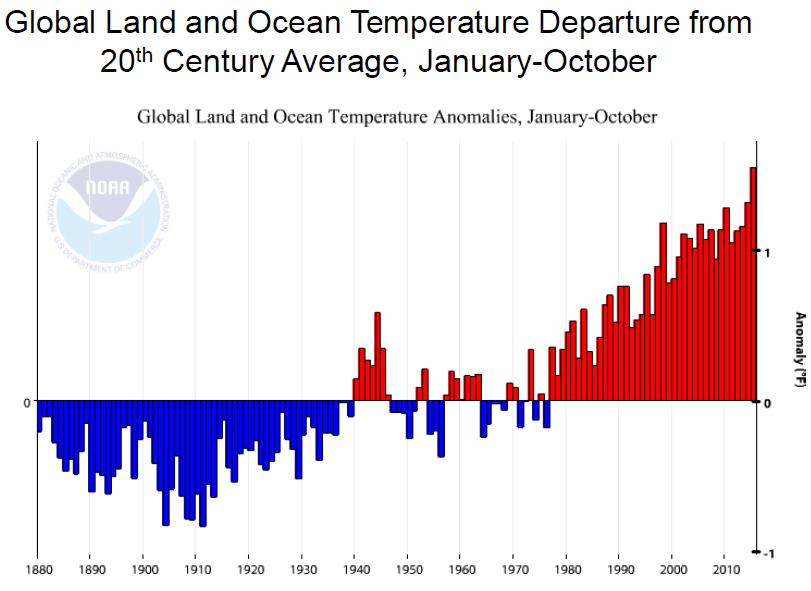
Scientists from NASA and other research institutions around the world have been routinely collecting temperature data from a wide number of locations all over the planet. Their records of Earth’s average temperature go back to the 1880s, the earliest year for which reliable instrumental records were available worldwide. The National Climatic Data Center (NCDC), which is part of the National Oceanic and Atmospheric Administration (NOAA), has maintained global average monthly and annual records of combined land and ocean surface temperatures for more than 130 years.
These data show that temperatures have climbed to more than 1.8°F (1°C) above pre-industrial levels as of 2015, and the long-term global upward trend is clear and unambiguous (Figure 1).
The 2013 Fifth Assessment Report (AR5) of the Intergovernmental Panel on Climate Change (IPCC) stated that “each of the last three decades has been successively warmer at the Earth’s surface than any preceding decade since 1850”. Data also shows that, globally, the last decade has been the warmest ever recorded. 2016 was the hottest year on record.
Adding to the evidence of direct temperature measurements, studies by independent teams of researchers indicate that the planet is undergoing one of the largest climate changes in Earth’s history, and also one of the fastest in the past 65 million years. Not only that, the current warming is projected to occur at a rate 10 times faster than any change over that period.
But how do we know Earth's temperature before 1880?
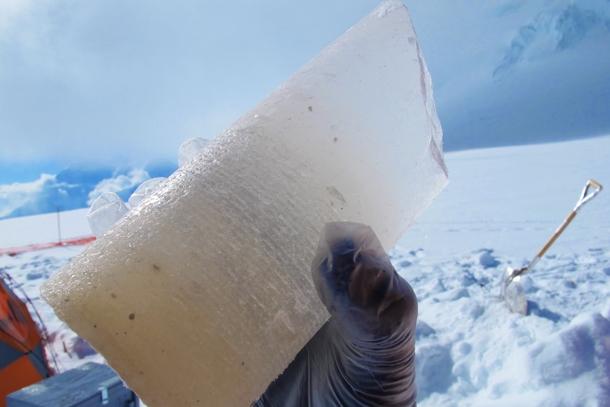
To understand climate trends from the past, before reliable measurement methods existed, climate experts rely on biological or physical archives—known as "proxies"—that preserve past temperature. Tree rings, coral skeletons, and glacial ice cores (Figure 3) are proxies for annual temperature records, while boreholes (holes drilled deep into Earth's crust) can show temperature shifts over longer periods of time.
The way scientists measure and interpret various proxies depends on the information each proxy provides. For example, to obtain temperature records from tree rings, scientists drill cores into several trees that are growing in a region. They identify site-specific factors that influence tree growth such as temperature, precipitation, altitude, and tree age, and then compare these factors against the width or density of the tree rings over the lifetime of the tree. Once researchers are confident about how local tree growth correlates to air temperature, they then seek out older trees in the region that are preserved (perhaps in a local swamp or lake). By matching rings from trees that partially overlap life spans, scientists can construct a continuous climate record over thousands of years.
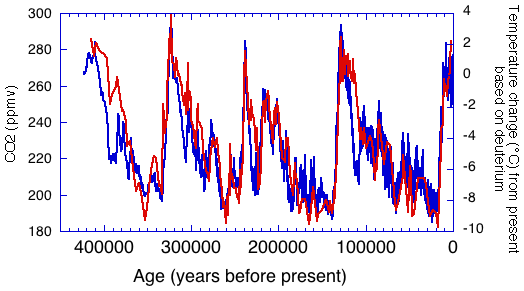
Ice cores have bands of light and dark areas with traces of various substances, which can be analyzed as to composition and age, yielding important information about the environmental conditions throughout time. Antarctic ice core records vividly illustrate that atmospheric carbon dioxide (CO2) levels today are higher than levels recorded over the past 800,000 years (Figure 4).
Atmospheric CO2 levels have risen 30 percent in the last 150 years, with half of that rise occurring only in the last three decades. It is a well-established scientific fact that CO2 (and other gases emitted from industrial and agricultural sources) traps heat in the atmosphere, so it is no surprise that we are now witnessing a dramatic increase in temperature.
Reconstructions of past climates
Much as the Air Force builds computer programs to simulate flight under different conditions, climate scientists build computer programs to help simulate global climate. These computer programs, called General Circulation Models (GCMs), use various assumptions about physical, chemical, and biological processes that occur within Earth's atmosphere and oceans and on its land surfaces. To ensure accuracy, each model is checked to see if it generates results that correctly reproduce the past and current climate. Once accuracy is established, the computer program can then be used to explore the likely future climate if, for example, we double the atmospheric concentration of carbon dioxide.
Earth’s climate in the past has been warmer and colder than it is now (Figure 5). Over the past million years, shifts in orbital cycles influenced the amount of sunlight falling on the northern hemisphere and played a major role in the waxing and waning of ice ages. Whenever atmospheric carbon dioxide increased naturally (either as a direct cause or as an amplifier, see this study), global surface temperature increased further. This held true even when local temperatures in the northern hemisphere and southern hemisphere might be out of phase due to factors including ocean circulation. Past climate evidence informs just how powerful carbon dioxide is. All else being equal, increases in atmospheric carbon dioxide lead to warmer global average surface temperatures. That is a proven relationship known since at least 1861 and confirmed throughout the years.
This is also true of the current warming trend--an increase in carbon dioxide is leading to an increase in temperatures. However, in this current warming episode, the increase in CO2 is largely due to human emissions from the burning of oil, coal, and gas (IPCC Fifth Assessment Report).
Navigating the Climate Change Minefield with Michael Mann
The "hockey stick" graph and its significance
The “hockey stick” graph, created by a group of climate researchers in the late 1990s, reflects average Northern Hemisphere temperature changes over the past several centuries. It was the first comprehensive study combining data from many different archives of temperature including tree rings, ice cores, and coral reefs.
It demonstrated that Northern Hemisphere temperatures rose sharply during the late 20th century, in marked contrast to the relatively small temperature fluctuations during the previous six centuries. The graph got its name because its shape resembles a hockey stick, with the blade end representing the sharp temperature rise over recent years.
As is typical of the scientific process, independent teams of researchers have worked to reproduce the results of the "hockey stick" by using their own approaches and even by using slightly different data. Despite small differences, they still yield the same essential conclusion: the past 10- to 20-year period was likely the warmest of the past millennium.
The hockey stick graph is a high-profile example among literally thousands of pieces of evidence that have contributed to the present scientific consensus on the human influence on global warming. We are observing real changes due to higher temperatures. Here are some examples from the AR5:
- Over the last two decades, the Greenland and Antarctic ice sheets have been losing mass, glaciers have continued to shrink almost worldwide, and Arctic sea ice and Northern Hemisphere spring snow cover have continued to decrease in extent.
- The rate of sea level rise since the mid-19th century has been larger than the rate during the previous two millennia.
- Carbon dioxide concentrations have increased by 40% since pre-industrial times, primarily from fossil fuel emissions and secondarily from net land use change emissions. The ocean has absorbed about 30% of the emitted anthropogenic carbon dioxide, causing ocean acidification.
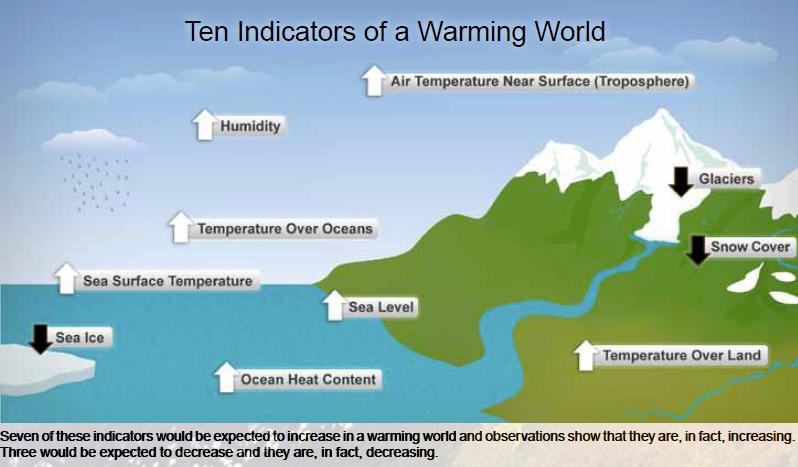
Surface temperature is only one indicator of climate change.
Glaciers are melting. Sea levels and ocean heat content are rising (Figure 7). Patterns of rainfall and snow, droughts and storms, and lake and sea ice are changing. Plant and animal distributions and interactions are shifting and changing, with potential severe effects on crop pests and food supplies.
These shifts are well documented and are largely attributed to human-caused global warming, because scientists can positively identify the “human fingerprints” associated with these changing patterns.
Compared with natural factors that influence climate (including solar variation and volcanic eruptions), human activities – primarily burning fossil fuels and deforestation – have been a major contributor to climate change over the last 50 years. Burning coal, oil and gas and destroying forests overloads the atmosphere with excess carbon dioxide, adding to heat-trapping gases that already are present in the atmosphere. Combined, these gases act like a blanket covering the earth. The human contribution to this effect is unmistakable: the part of the atmosphere where excess carbon dioxide accumulates has expanded and warmed dramatically in recent years precisely during the period when emissions from human activity have increased.
The “long” and “short” of temperature trends
When one hears the words “global warming,” the image that comes to mind is one of a globe where temperatures are going up constantly, like the water in a kettle on the burner of a stove that steadily rises in temperature. But when it comes to climate the process is not quite the same.
While global temperatures have been going up overall, the rate of warming varies. As a result, some years are warmer than others. That is because there are factors, like air and ocean circulation patterns, that affect both the rate and the intensity of the global warming. For example, every few years an ocean cycle appears in the Pacific ocean either as an El Niño and La Niña with global temperature and regional precipitation pattern changes.
Imagine that you add a few external factors to that imaginary warming kettle (a fan or air conditioning vent blowing directly at the stove; adding more water (hot or cold) to the kettle; a bucket of ice cubes sitting by its side; etc.) and what we have is a heating system that is affected by those other factors - but the water will still eventually boil unless the burner is turned off or turned down significantly.
The “burner” in global warming is represented by the heat-trapping emissions released to the atmosphere from the burning of coal, oil, and natural gas – and since that burner has not (yet!) been reduced significantly (enough for the heating to slow down and prevent boiling), what we have is a warming planet. Relatively short-term natural phenomena that cause global temperatures to fluctuate are also occurring throughout the seasons, which we experience as a result of the Earth’s tilted axis as it revolves around the sun.
Short-term effects and external factors make it possible to have “cooler” periods in regions even as the general trend of warming continues. For example, during late 2007 and early 2008, the tropical Pacific Ocean was much cooler than normal due to a strong La Niña episode that kept temperatures across much of the globe lower than usual. Nevertheless, both years were still among the warmest years on record and would have been even hotter without this short-term cooling effect. Conversely, in 2015, a very strong El Niño episode, which made the tropical Pacific Ocean warmer than normal, combined with human-induced global warming to make that year the hottest on record to date (Nov 2016). And needless to say, winters continue to be colder than summers, even though some are more or less cold.
Oscillations between cooler and warmer periods are therefore expected, and do not change the long-term trend of warming shown by the data. Focusing on the relatively short time periods where the rate of warming is slower in order to claim that global warming is not happening is a misleading way to use statistics, yet one that has been the focus of attention. If one starts to measure a warming trend from a much warmer year, the rate of warming is bound to be different from the long term trend, simply due to the starting point.
Climate, weather, and the United States
Climate is a good indicator of what to expect in general, such as cold days in February in New England. Weather, on the other hand, is what we actually experience, like a blustery, snowy day with temperatures in the low 20s. In other words, climate describes phenomena observed over long time periods, such as decades and centuries, while weather is observed over short time periods, such as days and weeks.
The Earth’s average temperature is continuing to rise, regardless of the fact that some parts of the United States can still experience atypically cold winters (see this page for more on that). Cold winters do not disprove the fact that temperatures are rising. Plus, the US land area covers only about two percent of the Earth’s surface, which means that even when much of the United States is cold, most of the rest of the world may be warmer.
Temperatures in the United States keep breaking records. In 2015 most of the country experienced temperatures above average or much above average, and unless global emissions are reduced significantly, the trend is likely to continue.
It’s not too late
The choices we make today can help determine what our climate will be like. Putting a limit on heat-trapping emissions and encouraging the use of healthier, cleaner energy technologies, such as solar and wind power, would help us to avoid the worst potential consequences of global warming. There are solutions.
Related resources
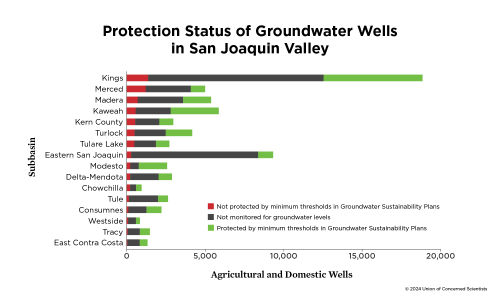
Understanding Future Groundwater Sustainability Scenarios

Earth Day Two Ways

Feet To The Fire