Coal, oil, and gas companies are now directly linked to worsening forest fires across the western United States.
A peer-reviewed study from the Union of Concerned Scientists found that 19.8 million acres of burned forest land—37 percent of the total area scorched by forest fires in the western United States and southwestern Canada since 1986—can be attributed to heat-trapping emissions traced to the world’s 88 largest fossil fuel producers and cement manufacturers.
Emissions from these companies and their products also contributed to nearly half of the increase in drought- and fire-danger conditions across the region since 1901.
The study—and other attribution studies like it—offers policymakers, elected officials, and legal experts a scientific basis for holding fossil fuel companies accountable for the impacts of their products and their decades-long deception efforts.
The Fossil Fuels Behind Forest Fires
This is an online version of the report. For the full text, please download the PDF.
The communities, cultures, and ecosystems of the western United States and southwestern Canada evolved alongside wildfire for thousands of years. Over the last several decades, however, climate change has altered the character of western wildfires. There are many ways to measure the growing toll these extreme wildfires are taking across the region: human deaths, homes reduced to ash, towns erased, acres scorched, days of smoke-choked air, and dollars spent preparing for fires, putting them out, and rebuilding in their wake.
The question of who bears responsibility for climate change and its impacts is being actively explored in both scientific and legal realms, along the same lines as discussions of corporations' responsibility for other damaging products. While nation-states and individuals shoulder some responsibility, corporations have historically been held accountable for at least some of the damages caused by their products, like asbestos and tobacco. Similarly, corporate entities—particularly fossil fuel companies—can and should be held accountable for climate harms.
As early as 1965, major fossil fuel companies and their industry associations were aware that the use of fossil fuels would negatively affect Earth's climate (Franta 2018). However, rather than shifting their business models or warning policymakers and the public, for decades these companies have operated campaigns of disinformation and deception about the causes and science of climate change while throwing their financial weight behind efforts to block any meaningful climate action.
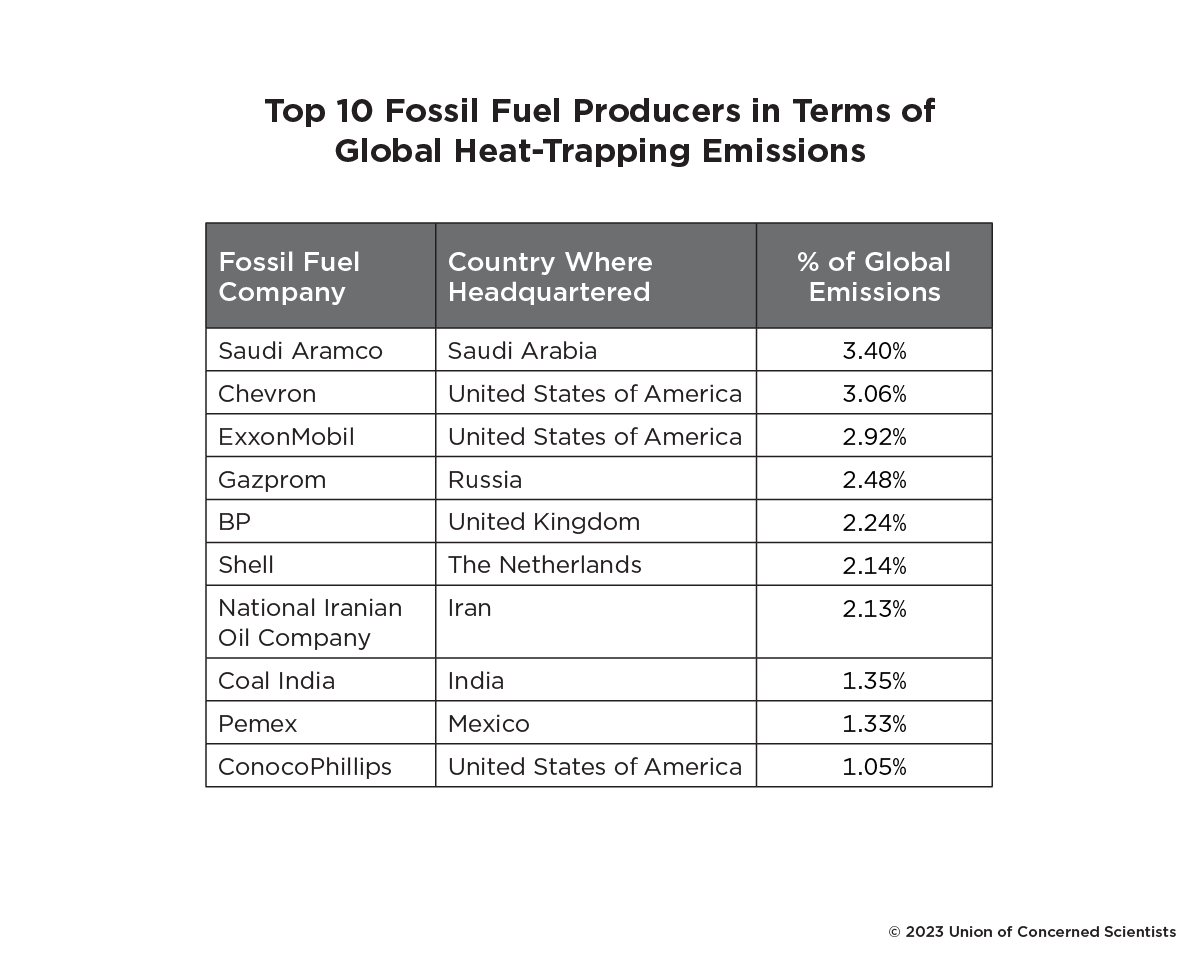
This analysis by the Union of Concerned Scientists (UCS) attributes portions of the observed increases in fire-danger conditions and burned forest area across the western United States and southwestern Canada (referred to here as western North America) to the world's 88 largest fossil fuel companies—including ExxonMobil, BP, Chevron, and Shell—and cement manufacturers (Table 1). The analysis finds that 37 percent of the cumulative burned forest area in western North America since 1986 can be traced to carbon emissions from these companies' products. In addition, 48 percent of the region's rise in fire-danger conditions since 1901, specifically the drying out of land and vegetation, can be traced back to carbon emissions from these companies.
As communities in the United States and around the world increasingly turn to the courts to hold fossil fuel companies accountable for harms that were foreseen and preventable, this analysis highlights and underscores the responsibility these companies bear for the impacts and costs of climate change.
Wildfires in Western North America
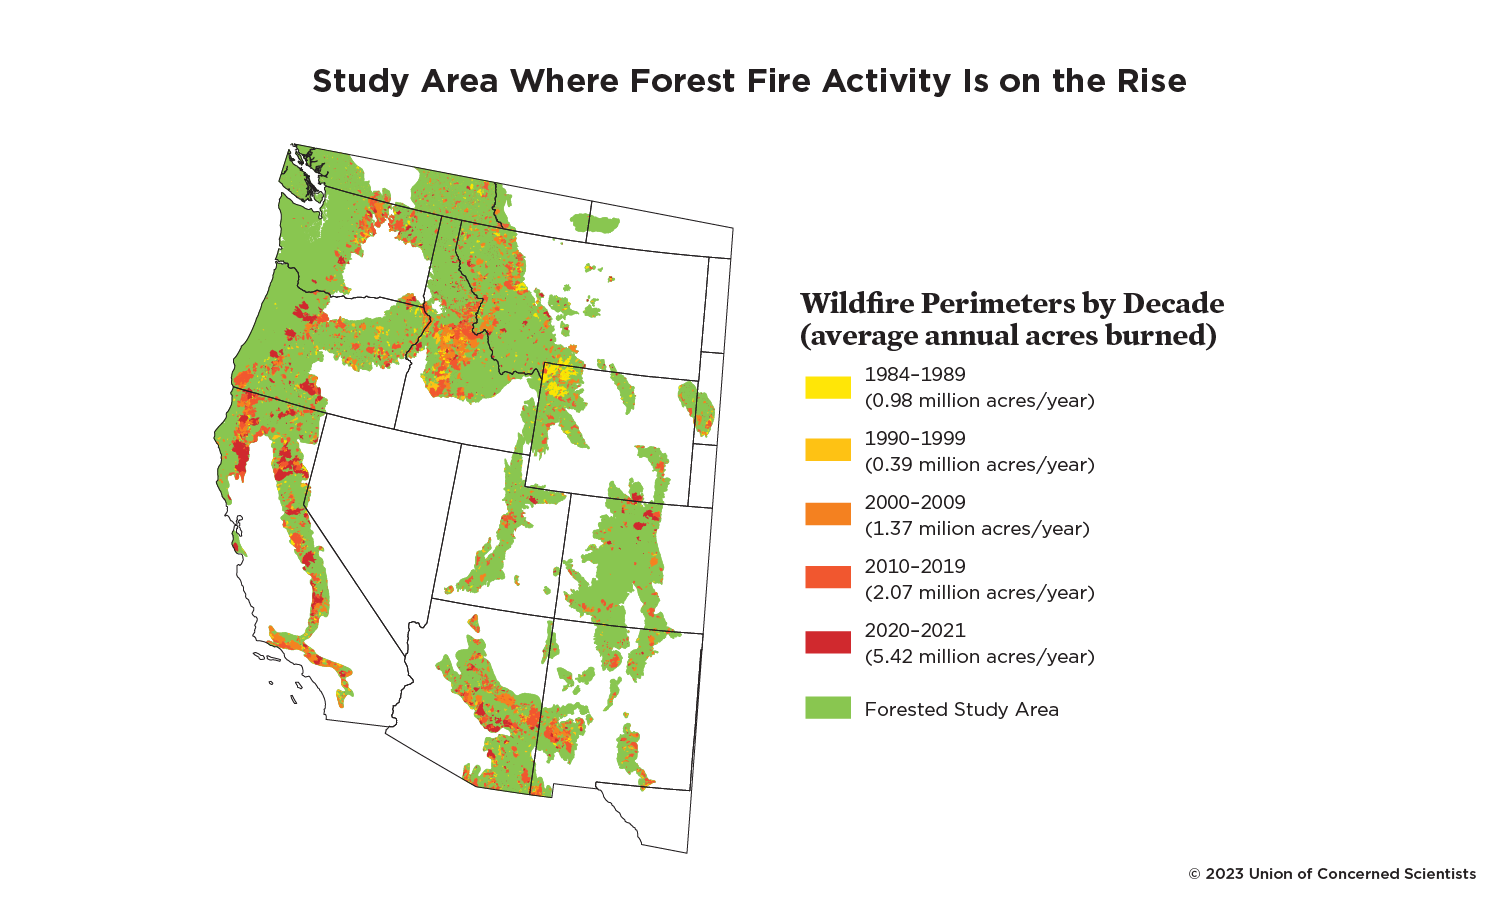
Over the past several decades, almost all aspects of wildfires have worsened across the forests of western North America (Figure 1). Wildfires are burning larger areas, more severely, at higher elevations, and over a longer fire season (Table 2). Historically, low- and mixed-severity fires, set carefully and intentionally by Indigenous peoples or ignited by lightning, occurred frequently and shaped the ecology of these forests (Hill et al. 2023). However, more than a century of aggressive, widespread fire suppression has led to a buildup of vegetation that normally would have burned in those regularly occurring fires. At the same time, human development in fire-prone areas has increased the number of accidental human-caused ignitions of fires and put more people and property in harm's way (Syphard et al. 2017). Given this confluence of factors, federal fire suppression costs have also skyrocketed, surpassing $4 billion in the United States in 2021 and more than doubling in Canada since 1985 (NIFC 2022; NRC 2021).
Climate change is causing hotter, drier conditions that are also fueling these increasingly large and severe wildfires. In particular, vapor pressure deficit (VPD), a measure of atmospheric "thirst," has emerged as a key way of tracking how climate change is amplifying wildfires because of its role in regulating water dynamics in ecosystems and, together with rising temperatures, contributing to increasing dryness (Box 1). Since the mid-1980s, these increases in aridity have contributed to a near doubling of the area burned by forest fires in western North America (Abatzoglou and Williams 2016), while the length of wildfire season has increased by nearly two months (Westerling 2016; Westerling et al. 2006).
Wildfires have profound impacts on the health and well-being of people, communities, and ecosystems. In an average year, dozens of civilians and firefighters lose their lives or livelihoods in wildfires across western North America, and millions more suffer indirect health impacts from harmful air quality and pollution from wildfire smoke (Haynes et al. 2020; Childs et al. 2022). Homes, schools, and infrastructure are lost to fires and mudslides, which can occur after fires when rain falls on burned soils that have lost the stabilizing effect of roots and become more water repellant. Wildfires can also compromise water quality, making it even more challenging for people to access clean water in drought-stricken areas and rural, disadvantaged communities (Phillips and Dahl 2022). As with many other climate impacts, longstanding racism and marginalization exacerbate wildfire and health risks for individuals and families with low incomes.
Findings
UCS used a combination of data and modeling to determine how much the carbon emissions associated with 88 major carbon producers (hereafter, the "big 88") have historically contributed to increases in VPD and burned forest area across the western United States and southwestern Canada (see Methodology). UCS modeling shows that emissions tied to the big 88 are responsible for increasing global average temperature by 0.5°C since the start of the 20th century, which is nearly half of the total observed warming since that time. The total increase in global average temperature has contributed to an 11 percent rise in VPD across western North America over the same time period. In turn, the rise in VPD has enabled a steep increase in the forest area that has burned across the region since the mid-1980s.
Observational data show that 57 percent of the observed rise in VPD since 1901 is attributable to emissions traced back to the big 88 (Figures 3 and 4). Climate model data indicate a slightly smaller contribution—48 percent with an interquartile range (IQR) of 32 to 63 percent—but the two datasets are in broad agreement that roughly half of the rise in VPD since the early 20th century is attributable to emissions associated with the big 88.
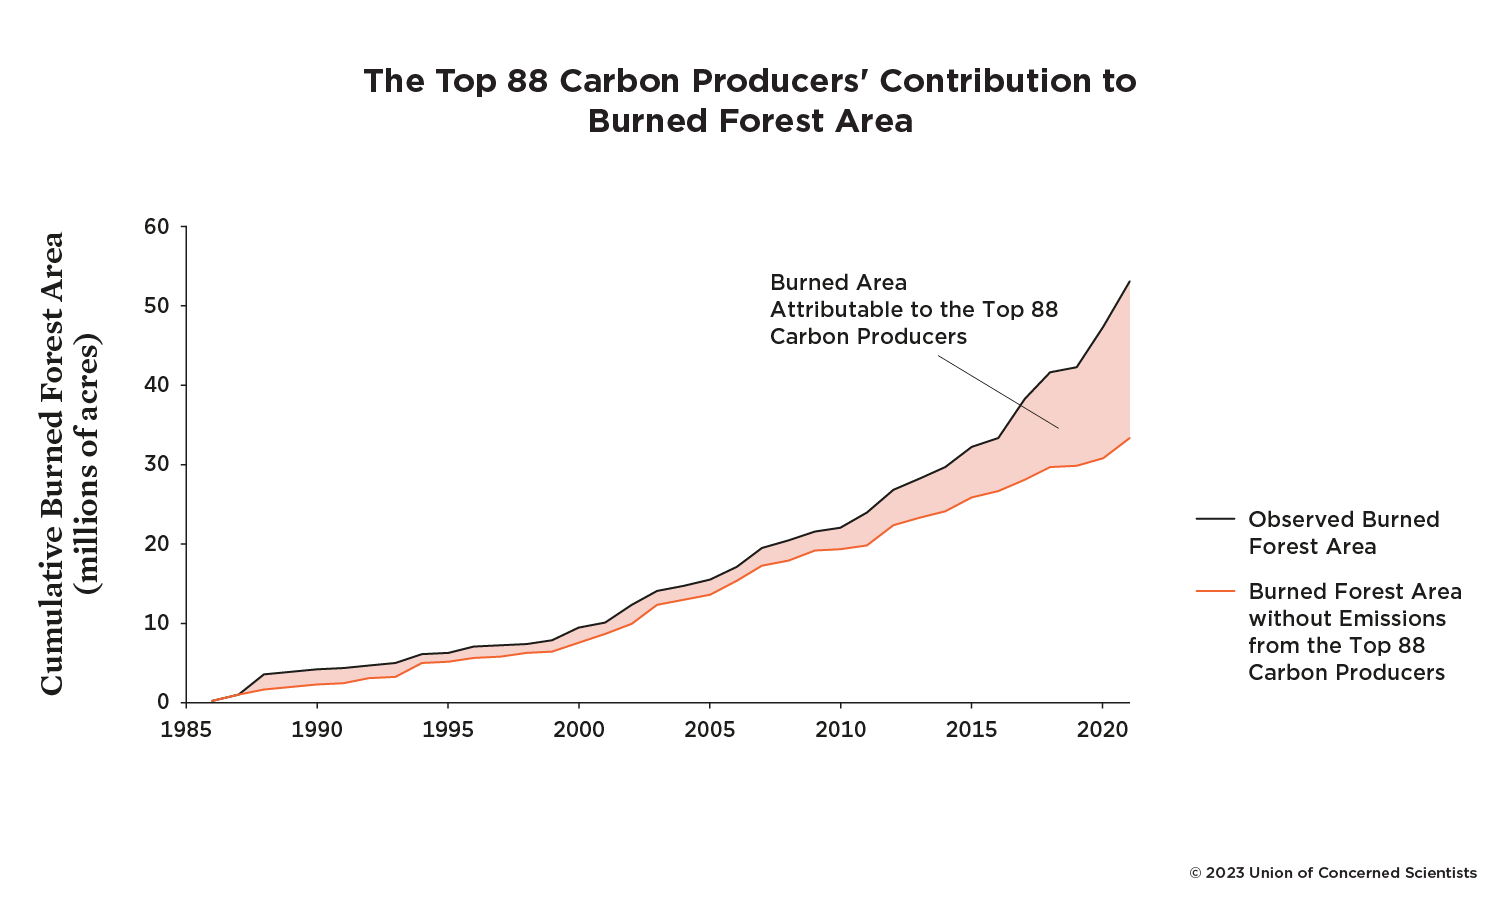
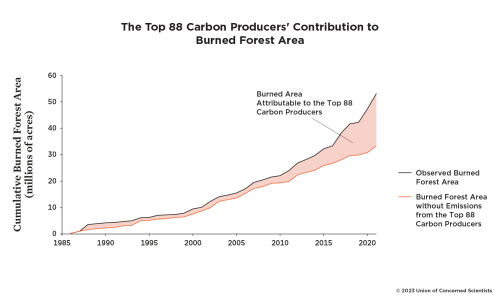
Across western North America, the area burned by forest fires increases exponentially as VPD increases, which means that relatively small changes in VPD result in large changes in burned forest area. The observed rise in VPD has enabled a steep increase in the forest area that has burned across the region since the mid-1980s. Since 1986,1 a cumulative 53.0 million acres of forest area has burned across western North America as VPD has risen. Without emissions tied to the big 88, the rise in VPD would have been much smaller, and 33.3 million acres (IQR 27.7 million--38.5 million) would have burned (Figure 4). That means that 37 percent (IQR 26--47 percent) of the cumulative burned forest area from 1986 to 2021 is attributable to emissions from the big 88. This represents nearly 19.8 million acres of burned forest area, or an area roughly the size of Maine.
Implications
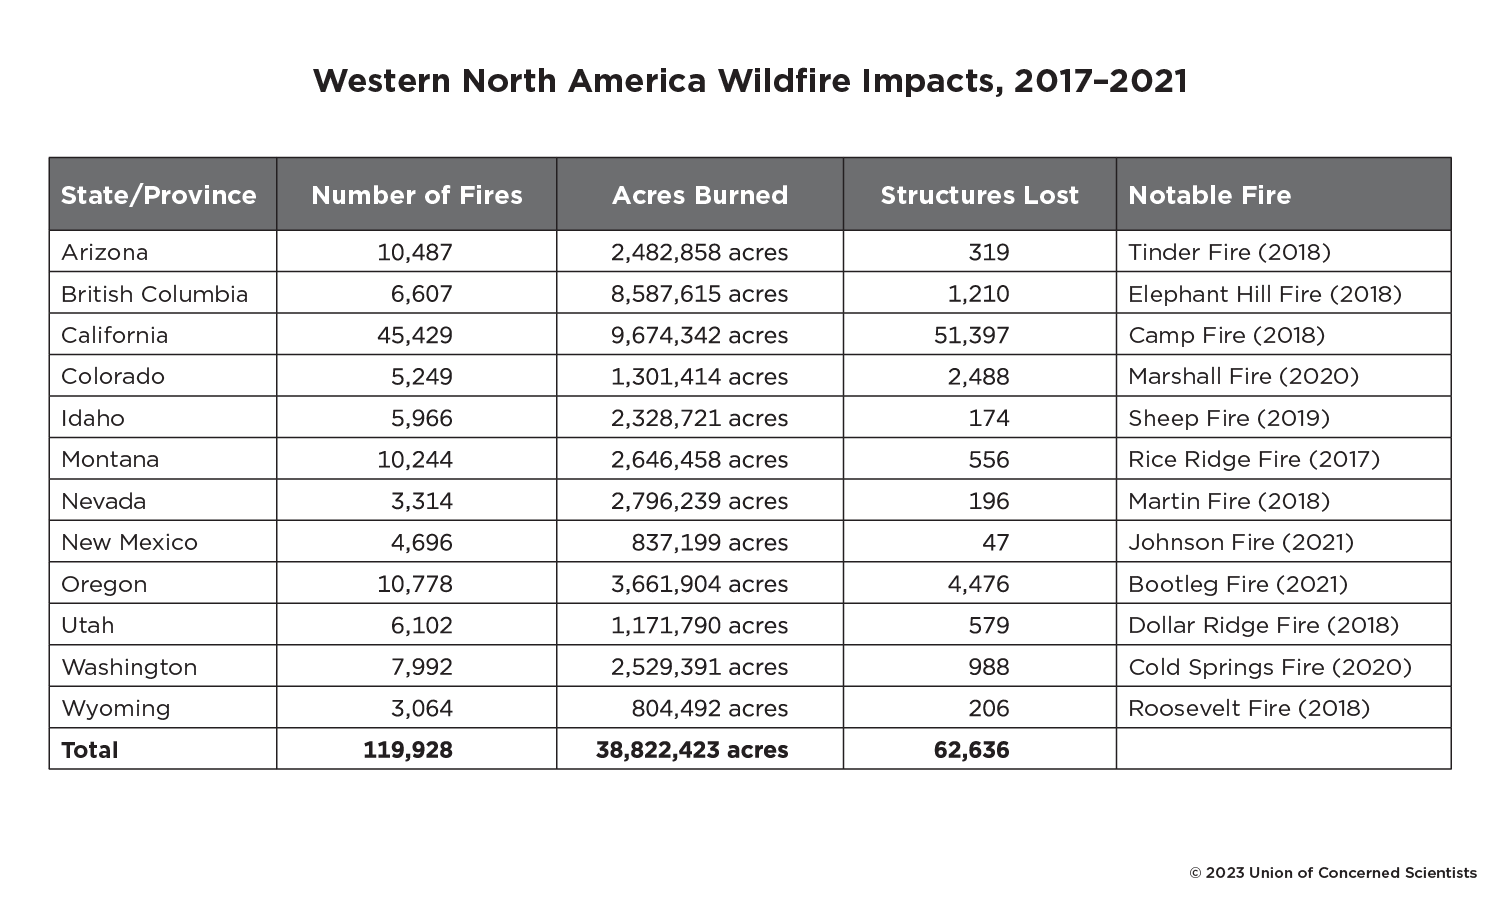
The direct threats from wildfires are striking: people and animals fleeing flames, firefighters rushing in to battle the blazes, and homes, buildings, and trees reduced to blackened landscapes. In California alone, between 2017 and 2021, wildfires killed 186 people, destroyed more than 51,000 structures, and caused damages exceeding $21 billion (CalFire 2022; Wang et al. 2021). Wildfires can displace whole communities, like those of Paradise, California, during the Camp Fire in 2018 and Malden, Washington, during the Cold Springs Fire in 2020. With affordable housing crises across the region, many face hardships when determining where to go after losing everything.
Wildfires also produce air pollution: particulate matter that can harm human health, particularly among vulnerable populations such as outdoor workers, children, and pregnant people (Heft-Neal et al. 2022; Chen et al. 2021; Haikerwal et al. 2016). Wildfire smoke pollution can infiltrate homes, making it difficult to avoid risks even by staying indoors. Purchasing high-quality masks and air purifiers is an economic burden, which means that low-income households disproportionately experience these risks (Burke et al. 2022).
Moreover, wildfires can compromise water quality and exacerbate drinking-water shortages, especially in drought-prone western North America (Phillips and Dahl 2022). Surviving a wildfire can also lead to lasting mental health effects, including post-traumatic stress disorder, anxiety, and depression (To, Eboreime, and Agyapong 2021).
The consequences of rising VPD extend beyond wildfire. High atmospheric "thirst" over multiple seasons or years can lead to drought conditions as vegetation dries out and water flow in streams and rivers decreases (Albano et al. 2022). These consequences have been experienced acutely across the US southwest since 2000, when a 23-year-long megadrought set in (Williams, Cook, and Smerdon 2022).
In California alone, crop revenue losses due to drought totaled $3 billion over the 2021--2022 period (Medellín-Azuara et al. 2022). Meanwhile, more than 1 million Californians lack access to clean, affordable drinking water, a number that grows higher during drought periods as overpumping of groundwater causes its levels to fall (Perrone and Jasechko 2017; Stokstad 2020). Reductions in water access affect people's health and finances as they are forced to purchase bottled water or interim tanks, fix pumps, or drill new wells.
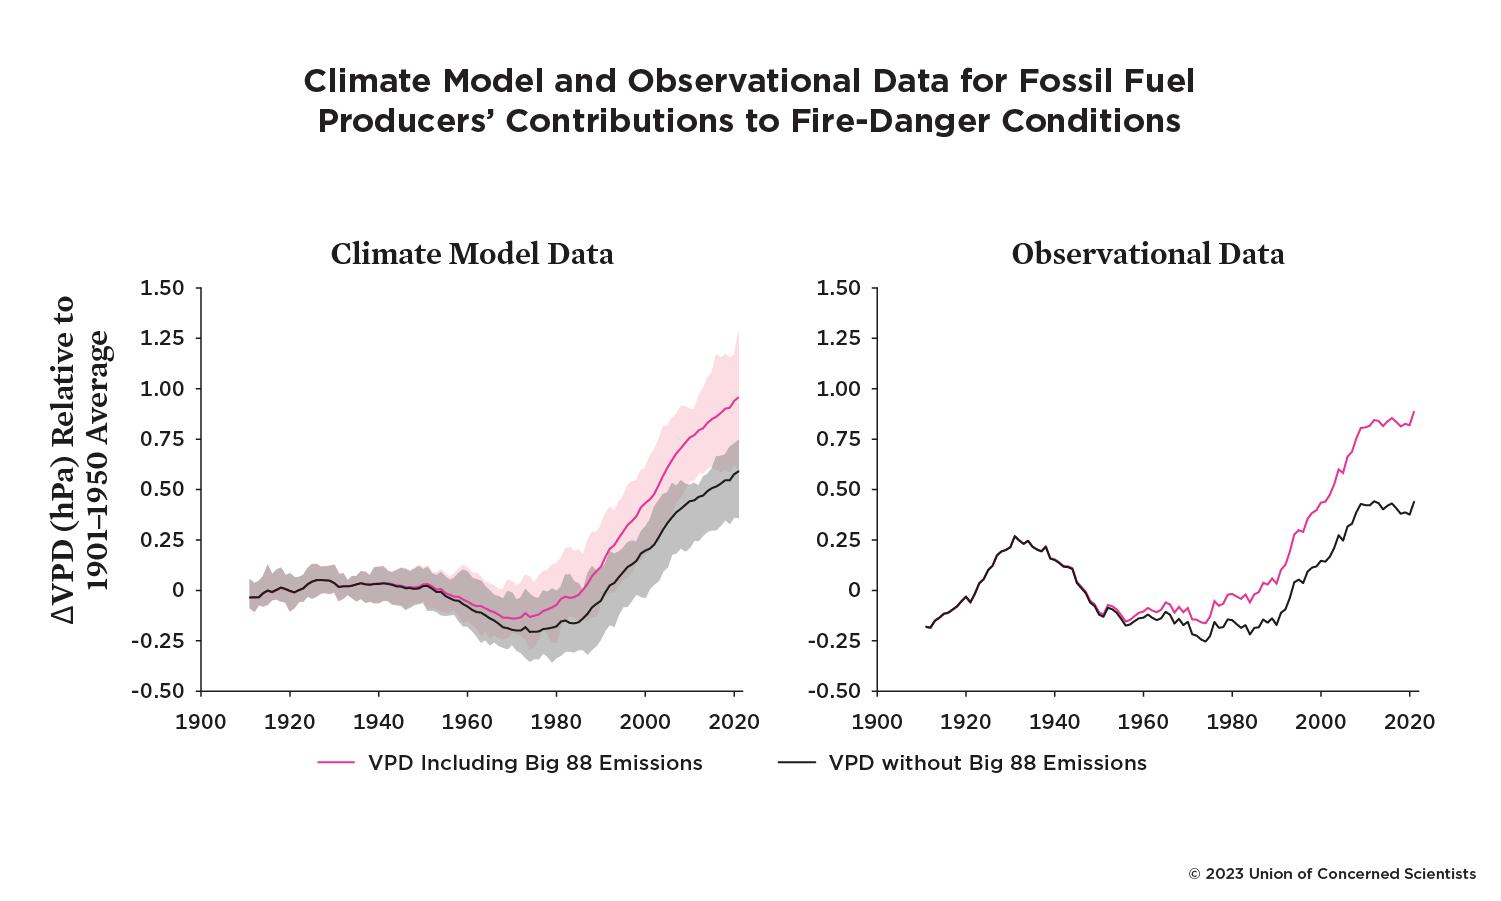
Note: The data shown here are relative to the 1901--1950 average and are smoothed to reflect a 21-year moving average.
Holding Fossil Fuel Producers and Cement Manufacturers Accountable
Emissions traced to major fossil fuel producers and cement manufacturers around the world have contributed to a dangerous and worsening fire regime in forests across western North America. Holding these companies accountable for the harms they have caused through both their emissions and their decades-long disinformation campaigns is critical to supporting and advancing efforts to build wildfire resilience (Frumhoff, Heede, and Oreskes 2015; Pinko et al. 2018; Shue 2017).
All companies operate with a social license, and companies that fail to act responsibly can lose the public's trust. The federal government and public officials at all levels have important roles to play in establishing corporate climate accountability. For example:
- The US Securities and Exchange Commission should finalize, implement, and enforce strong rules mandating standardized corporate climate disclosure.
- Congress and the Department of Justice should investigate past and ongoing climate disinformation by fossil fuel companies and their surrogates.
- Public prosecutors should hold fossil fuel polluters accountable for climate deception and damages.
- The Biden administration should follow through on its pledge to "strategically support" climate-related lawsuits against polluters.2
- Congress should deny fossil fuel polluters immunity from liability for climate deception or damages, the latter of which disproportionately harm Black and Brown communities and low-income communities.
- Federal and state governments should preserve access to justice through the courts for those experiencing climate impacts.
True accountability to the global climate and to communities affected by climate impacts will also require fossil fuel companies and their investors to commit to and implement major changes in their practices. These changes include:
- Renouncing disinformation on climate science and policy by ending greenwashing campaigns that downplay the climate crisis and make misleading or outright false claims about their own corporate environmental performance—for example, by exaggerating their investments in clean energy. These companies must also cut ties and funding to trade associations and other affiliated third parties that promote climate disinformation.
- Reducing heat-trapping emissions associated with their products and operations at a pace and scale consistent with the goals of the Paris Agreement.3
- Fully disclosing the climate impacts and economic risks of their businesses, including all scopes of global warming emissions associated with their operations and the use of their products, physical risks to their operations, and financial risks related to climate liability lawsuits.4
- Ceasing to fund or participate in efforts to delay or block climate policy.
- Paying their fair share of the costs of climate-related damages and climate change adaptation—including the costs associated with wildfire prevention, suppression, and recovery.
Additional Policies to Limit Harms from Wildfires
Even with improved corporate accountability, wildfire resilience-building needs are vast and must be better supported by existing programs and policies, as well as new ones in each of the categories below.
Rapidly Reducing Heat-Trapping Emissions. Robust action to reduce global heat-trapping emissions will both lower future wildfire risk and deliver numerous public health and economic benefits. The United States must implement just and equitable solutions that fulfill its commitments to, at a minimum, reduce its heat-trapping emissions to 50 to 52 percent below 2005 levels by 2030, and to achieve net-zero emissions no later than 2050.5 Implementing the 2022 Inflation Reduction Act and enacting strong carbon pollution and methane standards will be critical to meeting those commitments, as will enacting additional policies to reduce emissions.6
Reducing Human-Ignited Wildfires. The majority of wildfires in western North America are ignited by people and by electricity infrastructure (Balch et al. 2017; Coogan et al. 2020). Congress and states should pass legislation directing utility companies to plan and implement measures that prevent energy infrastructure from sparking fires while also engaging communities, protecting ecosystems, and ensuring the continued functioning of critical equipment. Federal, state, and local governments should also incentivize upgrades to existing properties in fire-risk zones—such as the creation of defensible space,7 the use of fireproof materials, and the adoption of the latest building codes.
Increasing Resources for Forest Health. To help restore the health of western forests after a century of aggressive fire suppression, Congress must allocate and sustain funding for identifying at-risk forests and scaling up forest treatments, such as thinning and prescribed burning, that can reduce the spread and severity of fires.8 Moreover, federal and state agencies should work to reduce barriers to the use of prescribed fire, including by Indigenous communities that have long used such fires for cultural and ecological purposes. As part of these efforts, government agencies and officials responsible for developing and implementing forest management strategies must respect tribal sovereignty, traditional ecological knowledge, cultural traditions, and local input (Clark, Miller, and Hankins 2022).
Protecting Community Health and Safety. Public health campaigns, programs, and policies are critical to addressing the direct and indirect threats wildfires pose to human safety and well-being, particularly for people who are young, elderly, or pregnant; who work outdoors; or who have pre-existing health conditions. To reduce potential exposure to wildfire and smoke, Congress should pass legislation directing agencies to improve wildfire behavior and smoke models as well as improve real-time safety communications to the public, local officials, and wildland firefighters.9 Local and state governments should also create robust water-monitoring systems and subsidize at-home water testing and treatment to ensure post-wildfire water safety.
State and local laws and zoning regulations are critical to reducing these dangers by placing limits on further development in the wildland-urban interface and investing in safe, affordable housing elsewhere. Lawmakers must ensure that fire insurance policies are transparent and affordable and should educate consumers on reducing insurance costs by adopting wildfire mitigation measures. In places where fire risks are increasingly untenable, public officials should engage communities directly in planning for their future, which, if they choose, could include just, equitable relocation to safer places.
Advancing, Tracking, and Coordinating Equitable Investments. Wildfire impacts often fall most heavily on people, households, and communities with the fewest resources to cope. In line with the Biden administration's Justice40 initiative,10 both pre- and post-fire federal investments must prioritize these communities as well as others that have long been marginalized. Federal agencies should also ensure that low-resourced communities are not burdened by difficult federal funding matches or reporting requirements. At the same time, states should prioritize these communities while building capacity to receive and distribute funding and to execute programs. Both federal and state agencies must ensure adequate funding for full tribal participation in planning, policymaking, and implementation when it comes to wildfire resilience investments (STACCWG 2021). To ensure the efficacy of resilience investments, the federal Wildland Fire Mitigation and Management Commission must swiftly develop and implement a comprehensive framework for coordinating fire-risk reduction measures across jurisdictions.
Conclusion
While countries and consumers have some responsibility for climate change and its impacts, fossil fuel companies can and should be held accountable for climate harms. Beginning in the 1960s, major fossil fuel companies and industry associations knew that the use of fossil fuels would negatively affect Earth's climate (Franta 2018). Despite this knowledge, companies have operated campaigns of disinformation and deception about the causes and science of climate change and worked hard to block meaningful climate action.
Communities around the world are taking to the courts to hold fossil fuel producers accountable for their deliberate deception and for harms that were foreseen and preventable. This accountability is particularly important in cases where those who have contributed least to the world's rising heat-trapping emissions are bearing the brunt of the consequences. The quantification of the fossil fuel industry's contributions to increasing fire-danger conditions and burned forest area described in this paper suggests that there may be legal grounds for pursuing accountability from the fossil fuel industry for wildfire impacts, risk reduction, resilience building, and hazard mitigation.
Emissions from the products of fossil fuel companies have fundamentally reshaped the climate of western North America and left behind a scarred, charred landscape in which people, their communities, and the ecosystems that enable their existence are suffering. To date, the general public has been footing the bills for preparing for, putting out, and rebuilding after wildfires, while fossil fuel producers rake in billions of dollars in profits (Halper 2023). Having long fanned the flames, the fossil fuel industry must start paying its fair share.
Methodology
This analysis used a combination of observational data and modeling to determine the contribution of the big 88 to observed changes in VPD and burned forest area in western North America. First, a global energy-balance carbon-cycle model was used to simulate the change in global average temperature since 1900 under two different scenarios, one including the carbon dioxide and methane emissions of the big 88 and one excluding those emissions. This yielded an estimate of how much the emissions associated with those producers contributed to the rise in global average temperature since 1900.Next, observational data and a suite of 28 global climate models were used to determine how increases in global average temperature were related to VPD in the forested lands of western North America.The contribution of the big 88 to regional VPD change since 1901 was then determined by multiplying their contribution to global average temperature change by the relationship between global average temperature and VPD.Finally, observational data from 1986 through 2021 were used to model the relationship between VPD and burned forest area. This relationship was then applied to the VPD change contributed by emissions from the big 88, which yielded an estimate of the contribution of these companies to cumulative burned forest area in western North America. Note that emissions data from the big 88 were only available through 2015 at the time of analysis. Emissions from the big 88 were therefore held constant over the period from 2015 to 2021. For the full methodology, see Dahl et al. (2023).
Limitations and Caveats
This analysis was limited to forested areas because the relationship between VPD and burned area is stronger for forested areas than for other ecosystems in the western United States and southwestern Canada. And while there have been many factors that have driven changes in wildfire behavior and risk in recent decades—including widespread fire suppression, the loss of Indigenous burning practices, and population growth in wildfire-prone areas—this study focused solely on the impact of warming temperatures on increases in VPD and burned forest area. Finally, the relationships between global average temperature, VPD, and burned forest area may not hold if one were to look at smaller subregions of the study area.
Authors
The authors are all in the UCS Climate and Energy Program. Kristina Dahl is a principal climate scientist, Carly Phillips is a research scientist, Alicia Race is a state resilience policy advocate, Shana Udvardy is a senior climate resilience policy analyst, and Pablo Ortiz is a senior bilingual water and climate scientist.
Acknowledgments
This report was made possible by the generous support of the Barr Foundation, Blanchette Hooker Rockefeller Fund, Farvue Foundation, Foundation for International Law for the Environment, Grantham Foundation for the Protection of the Environment, MacArthur Foundation, Rockefeller Family Fund, Scherman Foundation, Wallace Global Fund, Water Foundation, individual donors, and UCS members.
The authors thank three anonymous scholars who reviewed either this report or the associated publication in Environmental Research Letters. The report also benefited from the reviews and advice of many people within UCS, including Daniel Barad, Kate Cell, Rachel Cleetus, Sanjali De Silva, Brenda Ekwurzel, Adam Markham, Kathy Mulvey, Lisa Nurnberger, Ashley Siefert Nunes, and Coreen Weintraub. Finally, the authors thank Cynthia DeRocco, Anthony Eyring, Tyler Kemp-Benedict, Karin Matchett, Michelle Rama-Poccia, Heather Tuttle, and Bryan Wadsworth for editing and publication support.
Organizational affiliations are listed for identification purposes only. The opinions expressed herein do not necessarily reflect those of the organizations that funded the work or the individuals who informed or reviewed it. The Union of Concerned Scientists bears sole responsibility for the report's content.
References
Abatzoglou, John T., and A. Park Williams. 2016. "Impact of Anthropogenic Climate Change on Wildfire across Western US Forests." Proceedings of the National Academy of Sciences 113 (42): 11770--75. https://doi.org/10.1073/pnas.1607171113
Abatzoglou, John T., A. Park Williams, Luigi Boschetti, Maria Zubkova, and Crystal A. Kolden. 2018. "Global Patterns of Interannual Climate--Fire Relationships." Global Change Biology 24 (11): 5164--75. https://doi.org/10.1111/gcb.14405
Albano, Christine M., John T. Abatzoglou, Daniel J. McEvoy, Justin L. Huntington, Charles G. Morton, Michael D. Dettinger, and Thomas J. Ott. 2022. "A Multidataset Assessment of Climatic Drivers and Uncertainties of Recent Trends in Evaporative Demand Across the Continental United States." Journal of Hydrometeorology 23 (4): 505--19. https://doi.org/10.1175/JHM-D-21-0163.1
Baek, Y., T. Boettner, R. Cleetus, S. Clemmer, C. Esquivia-Zapata, C. Farly, B. Issac, et al. 2021. "A Transformative Climate Action Framework: Putting People at the Center of Our Nation's Clean Energy Transition." Cambridge, MA: Union of Concerned Scientists. https://www.ucsusa.org/resources/clean-energy-transformation
Balch, Jennifer K., Bethany A. Bradley, John T. Abatzoglou, R. Chelsea Nagy, Emily J. Fusco, and Adam L. Mahood. 2017. "Human-Started Wildfires Expand the Fire Niche across the United States." Proceedings of the National Academy of Sciences 114 (11): 2946--51. https://doi.org/10.1073/pnas.1617394114
Barrett, Kimiko. 2022. "Wildfires Destroy Thousands of Structures Each Year." Bozeman, MT: Headwaters Economics. https://headwaterseconomics.org/natural-hazards/structures-destroyed-by-wildfire/
BCWS (British Columbia Wildfire Service). 2022. "Wildfire Averages—Province of British Columbia." Province of British Columbia. 2022. https://www2.gov.bc.ca/gov/content/safety/wildfire-status/about-bcws/wildfire-statistics/wildfire-averages
Burke, Marshall, Sam Heft-Neal, Jessica Li, Anne Driscoll, Patrick Baylis, Matthieu Stigler, Joakim A. Weill, et al. 2022. "Exposures and Behavioural Responses to Wildfire Smoke." Nature Human Behaviour (July): 1--11. https://doi.org/10.1038/s41562-022-01396-6
CAI (Climate Accountability Institute). 2020. "Carbon Majors 2018 Data Set." Snowmass, CO. https://climateaccountability.org/carbonmajors_dataset2020.html
CalFire. 2022. "Statistics." 2022. Sacramento, CA: Department of Forestry and Fire Protection. https://www.fire.ca.gov/stats-events
Chen, Gongbo, Yuming Guo, Xu Yue, Shilu Tong, Antonio Gasparrini, Michelle L. Bell, Ben Armstrong, et al. 2021. "Mortality Risk Attributable to Wildfire-Related PM~2.5~ Pollution: A Global Time Series Study in 749 Locations." The Lancet Planetary Health 5 (9): e579--87. https://doi.org/10.1016/S2542-5196(21)00200-X
Childs, Marissa L., Jessica Li, Jeffrey Wen, Sam Heft-Neal, Anne Driscoll, Sherrie Wang, Carlos F. Gould, et al. 2022. "Daily Local-Level Estimates of Ambient Wildfire Smoke PM~2.5~ for the Contiguous US." Environmental Science & Technology 56 (19): 13607--21. https://doi.org/10.1021/acs.est.2c02934
Clark, Sara A., Andrew Miller, and Don L. Hankins. 2022. "Good Fire: Current Barriers to the Expansion of Cultural Burning and Prescribed Fire in California and Recommended Solutions." Karuk Tribe. https://karuktribeclimatechangeprojects.files.wordpress.com/2022/06/karuk-prescribed-fire-rpt_2022_v2-1.pdf
Coogan, Sean C. P., L. D. Daniels, Den Boychuk, Philip J. Burton, Mike D. Flannigan, Sylvia Gauthier, Victor Kafka, Jane S. Park, and B. Mike Wotton. 2020. "Fifty Years of Wildland Fire Science in Canada." Canadian Journal of Forest Research 51 (2): 283--302.
Dahl, Kristina, J. T. Abatzoglou, Carly Phillips, J. Pablo Ortiz-Partida, Rachel Licker, L. Delta Merner, and B. Ekwurzel. 2023. "Quantifying the Contribution of Major Carbon Producers to Increases in Vapor Pressure Deficit and Burned Area in Western US and Southwestern Canadian Forests." Environmental Research Letters.
EPA (Environmental Protection Agency). 2015. "Ecoregions of North America." Data and Tools. Washington, DC. https://www.epa.gov/eco-research/ecoregions-north-america
Franta, Benjamin. 2018. "Early Oil Industry Knowledge of CO~2~ and Global Warming." Nature Climate Change 8 (12): 1024--25. https://doi.org/10.1038/s41558-018-0349-9
Frumhoff, Peter C., Richard Heede, and Naomi Oreskes. 2015. "The Climate Responsibilities of Industrial Carbon Producers." Climatic Change 132 (2): 157--71. https://doi.org/10.1007/s10584-015-1472-5
Haikerwal, Anjali, Muhammad Akram, Malcolm R. Sim, Mick Meyer, Michael J. Abramson, and Martine Dennekamp. 2016. "Fine Particulate Matter (PM~2.5~) Exposure During a Prolonged Wildfire Period and Emergency Department Visits for Asthma." Respirology 21 (1): 88--94. https://doi.org/10.1111/resp.12613
Halper, Evan. 2023. "Shell Adds to Oil Industry's Record Profits, with $41.6 Billion." Washington Post, February 2, 2023. https://www.washingtonpost.com/business/2023/01/31/oil-profits-chevron-exxonmobil-earnings
Haynes, Katharine, Karen Short, Gavriil Xanthopoulos, Domingos Viegas, Luis Mário Ribeiro, and Raphaele Blanchi. 2020. "Wildfires and WUI Fire Fatalities." In Encyclopedia of Wildfires and Wildland-Urban Interface (WUI) Fires, edited by Samuel L. Manzello, 1--16. Springer International Publishing. https://doi.org/10.1007/978-3-319-51727-8_92-1
Heft-Neal, Sam, Anne Driscoll, Wei Yang, Gary Shaw, and Marshall Burke. 2022. "Associations Between Wildfire Smoke Exposure During Pregnancy and Risk of Preterm Birth in California." Environmental Research 203: 111872. https://doi.org/10.1016/j.envres.2021.111872
Hill, Avery P., Connor J. Nolan, Kyle S. Hemes, Trevor W. Cambron, and Christopher B. Field. 2023. "Low-Elevation Conifers in California's Sierra Nevada Are out of Equilibrium with Climate." PNAS Nexus 2 (2): pgad004. https://doi.org/10.1093/pnasnexus/pgad004
Medellín-Azuara, Josué, Alvar Escriva-Bou, José M. Rodríguez-Flores, Spencer A. Cole, John T. Abatzoglou, Joshua H. Viers, Nicholas Santos, and Daniel A. Summer. 2022. "Economic Impacts of the 2020-22 Drought on California Agriculture." Merced, CA: University of California--Merced. https://wsm.ucmerced.edu/wp-content/uploads/2022/11/Economic_Impact_CA_Drought_V01.pdf
MTBS (Monitoring Trends in Burn Severity). 2023. "Monitoring Trends in Burn Severity." 2023. https://www.mtbs.gov
NIFC (National Interagency Fire Center). 2022. "Federal Firefighting Costs (Suppression Only)." Boise, ID. https://www.nifc.gov/sites/default/files/document-media/suppcosts.pdf
---------. 2023. "WFIGS [Wildland Fire Interagency Geospatial Services] Current Interagency Fire Perimeters." Boise, ID. https://data-nifc.opendata.arcgis.com/datasets/nifc::wfigs-current-interagency-fire-perimeters/about
---------. n.d. "Statistics." Boise, ID. Accessed March 23, 2023. https://www.nifc.gov/fire-information/statistics
NRC (Natural Resources Canada). 2021. "Cost of Wildland Fire Protection." Ottawa, ON. https://www.nrcan.gc.ca/climate-change/impacts-adaptations/climate-change-impacts-forests/forest-change-indicators/cost-fire-protection/17783
---------. 2023. "Canadian National Fire Database." Ottawa, ON. https://cwfis.cfs.nrcan.gc.ca/ha/nfdb
Perrone, D., and S. Jasechko. 2017. "Dry Groundwater Wells in the Western United States." Environmental Research Letters 12 (10): 104002. https://doi.org/10.1088/1748-9326/aa8ac0
Phillips, Carly, and Kristina Dahl. 2022. Fire and Water in the Western United States: How Worsening Wildfires Threaten Water Resources in the West. Cambridge, MA: Union of Concerned Scientists. http://dx.doi.org/10.47923/2022.14633
Pinko, Nicole, Kathy Mulvey, Brenda Ekwurzel, Peter Frumhoff, Natalie Hurd, and Jean Sideris. 2018. The 2018 Climate Accountability Scorecard. Cambridge, MA: Union of Concerned Scientists. https://www.ucsusa.org/resources/climate-accountability-scorecard-0
Pinto de Moura, Maria Cecilia. 2022. Low-Carbon Pathways for Transportation: Ramping up vehicle electrification and phasing out petroleum. Cambridge, MA: Union of Concerned Scientists. https://www.ucsusa.org/resources/low-carbon-pathways-transportation
Shue, Henry. 2017. "Responsible for What? Carbon Producer CO~2~ Contributions and the Energy Transition." Climatic Change 144 (4): 591--96. https://doi.org/10.1007/s10584-017-2042-9
STACCWG (Status of Tribes and Climate Change Working Group). 2021. Status of Tribes and Climate Change Report, Institute for Tribal Environmental Professionals, Northern Arizona University, Flagstaff, AZ. [Marks-Marino, D. (ed.)] http://nau.edu/stacc2021
Stokstad, Erik. 2020. "Droughts Exposed California's Thirst for Groundwater. Now, the State Hopes to Refill Its Aquifers." Science, April 16, 2020. https://www.sciencemag.org/news/2020/04/droughts-exposed-california-s-thirst-groundwater-now-state-hopes-refill-its-aquifers
Syphard, Alexandra D., Jon E. Keeley, Anne H. Pfaff, and Ken Ferschweiler. 2017. "Human Presence Diminishes the Importance of Climate in Driving Fire Activity across the United States." Proceedings of the National Academy of Sciences 114 (52): 13750--55. https://doi.org/10.1073/pnas.1713885114
To, Patricia, Ejemai Eboreime, and Vincent I. O. Agyapong. 2021. "The Impact of Wildfires on Mental Health: A Scoping Review." Behavioral Sciences 11 (9): 126. https://doi.org/10.3390/bs11090126
Wang, Daoping, Dabo Guan, Shupeng Zhu, Michael Mac Kinnon, Guannan Geng, Qiang Zhang, Heran Zheng, et al. 2021. "Economic Footprint of California Wildfires in 2018." Nature Sustainability 4 (3): 252--60. https://doi.org/10.1038/s41893-020-00646-7
Westerling, Anthony LeRoy. 2016. "Increasing Western US Forest Wildfire Activity: Sensitivity to Changes in the Timing of Spring." Philosophical Transactions of the Royal Society B: Biological Sciences 371 (1696): 20150178. https://doi.org/10.1098/rstb.2015.0178
Westerling, A. L., H. G. Hidalgo, D. R. Cayan, and T. W. Swetnam. 2006. "Warming and Earlier Spring Increase Western U.S. Forest Wildfire Activity." Science 313 (5789): 940--43. https://doi.org/10.1126/science.1128834
Williams, A. Park, Benjamin I. Cook, and Jason E. Smerdon. 2022. "Rapid Intensification of the Emerging Southwestern North American Megadrought in 2020--2021." Nature Climate Change 12 (3): 232--34. https://doi.org/10.1038/s41558-022-01290-z
Endnotes
- Consistent, reliable burned-area estimates across western North American are only available starting in 1986.
- See https://joebiden.com/environmental-justice-plan.
- The Paris Agreement is an international treaty on addressing climate change. See https://unfccc.int/process-and-meetings/the-paris-agreement.
- For more information on scope 1, 2, and 3 emissions, see https://ghgprotocol.org/sites/default/files/standards_supporting/FAQ.pdf.
- See https://www.whitehouse.gov/briefing-room/statements-releases/2021/04/22/fact-sheet-president-biden-sets-2030-greenhouse-gas-pollution-reduction-target-aimed-at-creating-good-paying-union-jobs-and-securing-u-s-leadership-on-clean-energy-technologies/.
- Additional policies must advance clean electricity, energy efficiency, zero-emissions vehicles, mass transit, electrification of buildings and industrial processes, and healthy soils and forests (Baek et al. 2021; Pinto de Moura 2022).
- Structural ignitability and defensible space, an area around a structure that is designed to reduce fire risk, are key components of protecting properties from wildfire. For more information, see https://csfs.colostate.edu/wildfire-mitigation/protect-your-home-property-from-wildfire/.
- Efforts to identify at-risk forests include the US Forest Service's 10-year wildfire crisis strategy. See https://www.fs.usda.gov/managing-land/wildfire-crisis.
- SeeH.R.550, FIRE Act of 2023, www.congress.gov/bill/118th-congress/house-bill/550; https://www.usfa.fema.gov/downloads/pdf/publications/wui-issues-resolutions-report.pdf; H.R.369, NIST Wildland Fire Communications and Information Dissemination Act, www.congress.gov/bill/118th-congress/house-bill/369.
- Seethe White House Justice40, A Whole-of-Government Initiative, www.whitehouse.gov/environmentaljustice/justice40/.
- The observational data showed a positive relationship between global average temperature and regional March-September VPD of 0.99 hPa/°C or 13.4%/°C. All CMIP6 models also showed a positive relationship between global average temperature and regional March-September VPD, with a 28-model mean of 0.81 hPa/°C (IQR 0.53--1.05 hPa/°C) or 12.9%/°C.
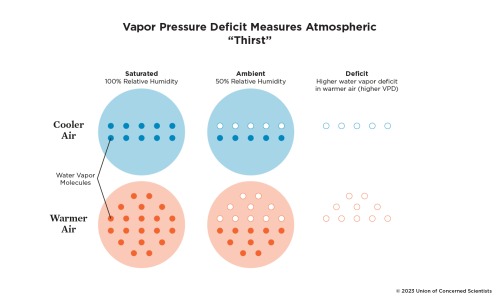
Vapor pressure deficit (VPD) is a measure of the ability of air to draw water out of plants and soils. Because dry vegetation ignites more easily than moist vegetation, VPD is also a measure of fire-danger conditions. VPD is calculated as the difference between the amount of moisture that is actually in the air and the amount of moisture the air would hold if saturated. It is similar to relative humidity, which uses a percentage to describe how much moisture is in the air. But unlike relative humidity, VPD calculations factor in temperature, which is important because warmer air has the potential to hold more moisture than cooler air.
Figure 2 illustrates how warming temperatures can increase VPD. The two circles on the left show air masses of different temperatures at 100 percent relative humidity. Both air masses are saturated, but the amount of moisture required to reach saturation at the warmer temperature is double that of the cooler one. The two center circles ("ambient") show air masses of different temperatures at 50 percent relative humidity. At both temperature levels they are holding half as much water as they would if they were saturated. In contrast, as shown on the right, the warmer air mass has a much higher VPD than the cooler air mass even at the same relative humidity because the warmer air mass could hold more water vapor.
Because warmer air can hold more water vapor, rising temperatures associated with climate change are causing VPD across western North America to rise as well. Both observational and climate model data show that for every 1.8°F (1°C) rise in global average temperature, VPD across western North America rises by approximately 13 percent.11
When VPD is high (meaning the air could hold a lot more moisture), plants lose water more quickly each time they open their pores when they perform photosynthesis. Over multiple weeks, months, and years, elevated VPD can lead to dried-out vegetation that can more easily ignite. The ability of VPD to reflect the dryness of vegetation makes it a better metric than the more familiar relative humidity for measuring the atmosphere's influence on the vegetation that spreads fire. Across western North America, years with high VPD are associated with greater forest fire area (Abatzoglou et al. 2018).
This is an online version of the report. For the full text, please download the PDF.
In this report

Wildfires and Fossil Fuel Companies

We Didn't Start The Fire
The Infuriating Link Between Wildfires and Fossil Fuel Companies
Burned Forest Area Attributable to Polluters
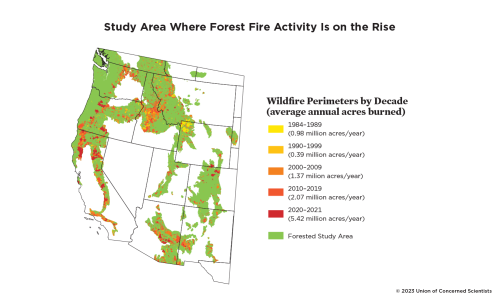
Where is Fire Activity Rising?
What is VPD?
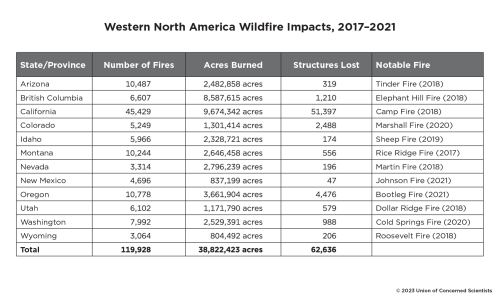
Wildfire Impacts, 2017-2021
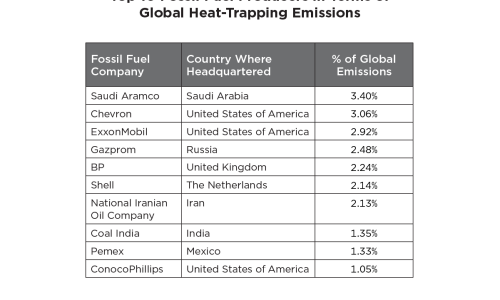
The World's Top Polluters
Downloads
Citation
Dahl, Kristina, Carly Phillips, Alicia Race, Shana Udvardy, and Pablo Ortiz. 2023. The Fossil Fuels behind Forest Fires: Quantifying the Contribution of Major Carbon Producers to Increasing Wildfire Risk in Western North America. Cambridge, MA: Union of Concerned Scientists. https://doi.org/10.47923/2023.15046
Related resources

Water, Water Every Where

Looming Deadlines for Coastal Resilience

Follow the Money
